Spiribacter curvatus
Taxonomy: cellular organisms; Bacteria; Proteobacteria; Gammaproteobacteria; Chromatiales; Ectothiorhodospiraceae; Spiribacter
Average proteome isoelectric point is 6.04
Get precalculated fractions of proteins

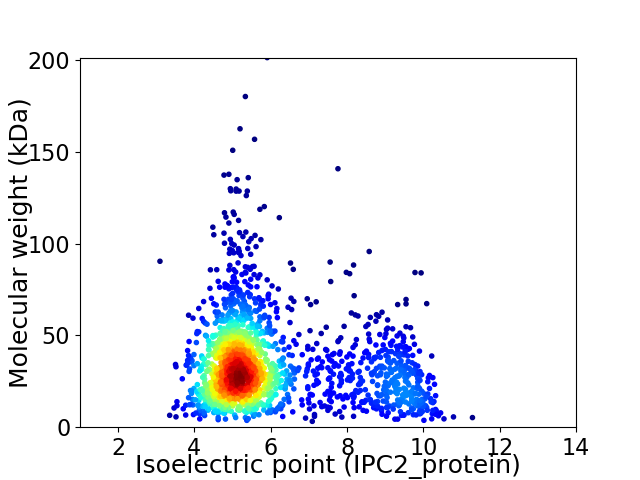
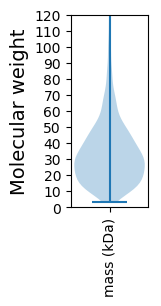
Virtual 2D-PAGE plot for 1861 proteins (isoelectric point calculated using IPC2_protein)
Get csv file with sequences according to given criteria:
* You can choose from 21 different methods for calculating isoelectric point
Summary statistics related to proteome-wise predictions


Protein with the lowest isoelectric point:
>tr|U5T2F3|U5T2F3_9GAMM Uncharacterized protein OS=Spiribacter curvatus OX=1335757 GN=SPICUR_02910 PE=4 SV=1
MM1 pKa = 7.06MKK3 pKa = 9.02KK4 pKa = 6.52TTSALAIAALLGTGAATAATFQINDD29 pKa = 3.57TTTVGVGGAFYY40 pKa = 10.4PFYY43 pKa = 11.3GDD45 pKa = 3.87VNDD48 pKa = 4.73ANGDD52 pKa = 3.7SSSFNGDD59 pKa = 2.76ASRR62 pKa = 11.84LIFTAEE68 pKa = 3.71KK69 pKa = 10.32AAVNGMTASLYY80 pKa = 9.75YY81 pKa = 9.62QLRR84 pKa = 11.84PQDD87 pKa = 3.83GLGDD91 pKa = 4.01GADD94 pKa = 3.98GSDD97 pKa = 3.92DD98 pKa = 3.79NNGVSTHH105 pKa = 5.37VAHH108 pKa = 6.67ATLSGDD114 pKa = 3.8FGSVTYY120 pKa = 10.42GKK122 pKa = 10.14NDD124 pKa = 3.05NLMYY128 pKa = 10.4RR129 pKa = 11.84YY130 pKa = 9.61IDD132 pKa = 3.41VLRR135 pKa = 11.84DD136 pKa = 3.6YY137 pKa = 11.62NDD139 pKa = 3.42TLVFTFSDD147 pKa = 4.68AIQRR151 pKa = 11.84RR152 pKa = 11.84RR153 pKa = 11.84VATYY157 pKa = 9.75ASPDD161 pKa = 3.24FGGFGFEE168 pKa = 4.52VEE170 pKa = 4.9AEE172 pKa = 4.16LEE174 pKa = 4.22ADD176 pKa = 3.78DD177 pKa = 5.29SKK179 pKa = 10.41TPVSDD184 pKa = 4.02GSSSSFNAAAYY195 pKa = 10.4ADD197 pKa = 4.41LDD199 pKa = 3.91PVRR202 pKa = 11.84VHH204 pKa = 6.18ATYY207 pKa = 9.1TAGDD211 pKa = 3.96LQDD214 pKa = 4.37ADD216 pKa = 3.72SDD218 pKa = 4.19GAYY221 pKa = 10.49GLAAVTSINVVDD233 pKa = 5.24LSAVYY238 pKa = 10.01TNSQINADD246 pKa = 3.93DD247 pKa = 3.67QVITGLYY254 pKa = 10.3ASTDD258 pKa = 3.48YY259 pKa = 11.67GFGSLHH265 pKa = 6.88LGAQEE270 pKa = 3.84VDD272 pKa = 2.94VDD274 pKa = 3.81NAEE277 pKa = 4.1SRR279 pKa = 11.84TEE281 pKa = 3.85VIGRR285 pKa = 11.84VTYY288 pKa = 10.52DD289 pKa = 2.95IADD292 pKa = 3.54SVYY295 pKa = 10.64TSLEE299 pKa = 4.16YY300 pKa = 10.57ASKK303 pKa = 11.0DD304 pKa = 3.33ADD306 pKa = 3.54NDD308 pKa = 3.87AGDD311 pKa = 4.08GFGVALWYY319 pKa = 10.73GFF321 pKa = 3.68
MM1 pKa = 7.06MKK3 pKa = 9.02KK4 pKa = 6.52TTSALAIAALLGTGAATAATFQINDD29 pKa = 3.57TTTVGVGGAFYY40 pKa = 10.4PFYY43 pKa = 11.3GDD45 pKa = 3.87VNDD48 pKa = 4.73ANGDD52 pKa = 3.7SSSFNGDD59 pKa = 2.76ASRR62 pKa = 11.84LIFTAEE68 pKa = 3.71KK69 pKa = 10.32AAVNGMTASLYY80 pKa = 9.75YY81 pKa = 9.62QLRR84 pKa = 11.84PQDD87 pKa = 3.83GLGDD91 pKa = 4.01GADD94 pKa = 3.98GSDD97 pKa = 3.92DD98 pKa = 3.79NNGVSTHH105 pKa = 5.37VAHH108 pKa = 6.67ATLSGDD114 pKa = 3.8FGSVTYY120 pKa = 10.42GKK122 pKa = 10.14NDD124 pKa = 3.05NLMYY128 pKa = 10.4RR129 pKa = 11.84YY130 pKa = 9.61IDD132 pKa = 3.41VLRR135 pKa = 11.84DD136 pKa = 3.6YY137 pKa = 11.62NDD139 pKa = 3.42TLVFTFSDD147 pKa = 4.68AIQRR151 pKa = 11.84RR152 pKa = 11.84RR153 pKa = 11.84VATYY157 pKa = 9.75ASPDD161 pKa = 3.24FGGFGFEE168 pKa = 4.52VEE170 pKa = 4.9AEE172 pKa = 4.16LEE174 pKa = 4.22ADD176 pKa = 3.78DD177 pKa = 5.29SKK179 pKa = 10.41TPVSDD184 pKa = 4.02GSSSSFNAAAYY195 pKa = 10.4ADD197 pKa = 4.41LDD199 pKa = 3.91PVRR202 pKa = 11.84VHH204 pKa = 6.18ATYY207 pKa = 9.1TAGDD211 pKa = 3.96LQDD214 pKa = 4.37ADD216 pKa = 3.72SDD218 pKa = 4.19GAYY221 pKa = 10.49GLAAVTSINVVDD233 pKa = 5.24LSAVYY238 pKa = 10.01TNSQINADD246 pKa = 3.93DD247 pKa = 3.67QVITGLYY254 pKa = 10.3ASTDD258 pKa = 3.48YY259 pKa = 11.67GFGSLHH265 pKa = 6.88LGAQEE270 pKa = 3.84VDD272 pKa = 2.94VDD274 pKa = 3.81NAEE277 pKa = 4.1SRR279 pKa = 11.84TEE281 pKa = 3.85VIGRR285 pKa = 11.84VTYY288 pKa = 10.52DD289 pKa = 2.95IADD292 pKa = 3.54SVYY295 pKa = 10.64TSLEE299 pKa = 4.16YY300 pKa = 10.57ASKK303 pKa = 11.0DD304 pKa = 3.33ADD306 pKa = 3.54NDD308 pKa = 3.87AGDD311 pKa = 4.08GFGVALWYY319 pKa = 10.73GFF321 pKa = 3.68
Molecular weight: 33.78 kDa
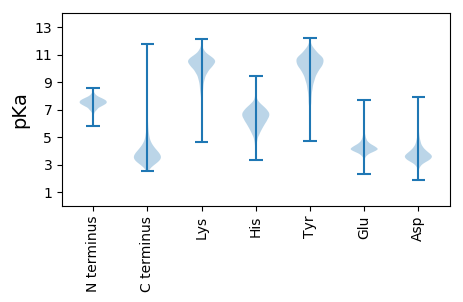
Isoelectric point according different methods:
Protein with the highest isoelectric point:
>tr|U5T906|U5T906_9GAMM Bac_transf domain-containing protein OS=Spiribacter curvatus OX=1335757 GN=SPICUR_09155 PE=3 SV=1
MM1 pKa = 7.45KK2 pKa = 9.51RR3 pKa = 11.84TFQPSVIKK11 pKa = 10.5RR12 pKa = 11.84KK13 pKa = 9.44RR14 pKa = 11.84NHH16 pKa = 5.44GFRR19 pKa = 11.84ARR21 pKa = 11.84MATRR25 pKa = 11.84NGRR28 pKa = 11.84KK29 pKa = 8.84VLARR33 pKa = 11.84RR34 pKa = 11.84RR35 pKa = 11.84AKK37 pKa = 10.32GRR39 pKa = 11.84ARR41 pKa = 11.84LTPP44 pKa = 3.93
MM1 pKa = 7.45KK2 pKa = 9.51RR3 pKa = 11.84TFQPSVIKK11 pKa = 10.5RR12 pKa = 11.84KK13 pKa = 9.44RR14 pKa = 11.84NHH16 pKa = 5.44GFRR19 pKa = 11.84ARR21 pKa = 11.84MATRR25 pKa = 11.84NGRR28 pKa = 11.84KK29 pKa = 8.84VLARR33 pKa = 11.84RR34 pKa = 11.84RR35 pKa = 11.84AKK37 pKa = 10.32GRR39 pKa = 11.84ARR41 pKa = 11.84LTPP44 pKa = 3.93
Molecular weight: 5.23 kDa
Isoelectric point according different methods:
Peptides (in silico digests for buttom-up proteomics)
Below you can find in silico digests of the whole proteome with Trypsin, Chymotrypsin, Trypsin+LysC, LysN, ArgC proteases suitable for different mass spec machines.| Try ESI |
 |
|---|
| ChTry ESI |
 |
|---|
| ArgC ESI |
 |
|---|
| LysN ESI |
 |
|---|
| TryLysC ESI |
 |
|---|
| Try MALDI |
 |
|---|
| ChTry MALDI |
 |
|---|
| ArgC MALDI |
 |
|---|
| LysN MALDI |
 |
|---|
| TryLysC MALDI |
 |
|---|
| Try LTQ |
 |
|---|
| ChTry LTQ |
 |
|---|
| ArgC LTQ |
 |
|---|
| LysN LTQ |
 |
|---|
| TryLysC LTQ |
 |
|---|
| Try MSlow |
 |
|---|
| ChTry MSlow |
 |
|---|
| ArgC MSlow |
 |
|---|
| LysN MSlow |
 |
|---|
| TryLysC MSlow |
 |
|---|
| Try MShigh |
 |
|---|
| ChTry MShigh |
 |
|---|
| ArgC MShigh |
 |
|---|
| LysN MShigh |
 |
|---|
| TryLysC MShigh |
 |
|---|
General Statistics
Number of major isoforms |
Number of additional isoforms |
Number of all proteins |
Number of amino acids |
Min. Seq. Length |
Max. Seq. Length |
Avg. Seq. Length |
Avg. Mol. Weight |
|---|---|---|---|---|---|---|---|
0 |
600998 |
31 |
1839 |
322.9 |
35.21 |
Amino acid frequency
Ala |
Cys |
Asp |
Glu |
Phe |
Gly |
His |
Ile |
Lys |
Leu |
|---|---|---|---|---|---|---|---|---|---|
12.065 ± 0.068 | 0.839 ± 0.014 |
6.425 ± 0.046 | 6.074 ± 0.054 |
3.215 ± 0.033 | 8.648 ± 0.051 |
2.309 ± 0.024 | 5.043 ± 0.041 |
1.824 ± 0.035 | 10.604 ± 0.073 |
Met |
Asn |
Gln |
Pro |
Arg |
Ser |
Thr |
Val |
Trp |
Tyr |
|---|---|---|---|---|---|---|---|---|---|
2.418 ± 0.025 | 2.379 ± 0.027 |
5.04 ± 0.04 | 3.608 ± 0.029 |
8.17 ± 0.065 | 5.11 ± 0.033 |
5.226 ± 0.036 | 7.404 ± 0.053 |
1.345 ± 0.023 | 2.254 ± 0.025 |
Most of the basic statistics you can see at this page can be downloaded from this CSV file
Proteome-pI is available under Creative Commons Attribution-NoDerivs license, for more details see here
| Reference: Kozlowski LP. Proteome-pI 2.0: Proteome Isoelectric Point Database Update. Nucleic Acids Res. 2021, doi: 10.1093/nar/gkab944 | Contact: Lukasz P. Kozlowski |
