Vibrio sp. 10N.286.49.C2
Taxonomy: cellular organisms; Bacteria; Proteobacteria; Gammaproteobacteria; Vibrionales; Vibrionaceae; Vibrio; unclassified Vibrio
Average proteome isoelectric point is 6.01
Get precalculated fractions of proteins

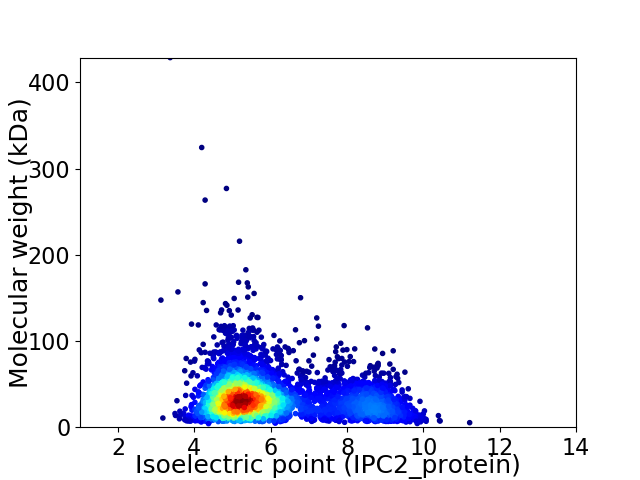
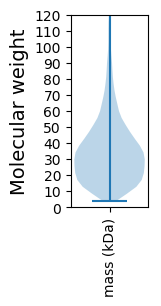
Virtual 2D-PAGE plot for 4338 proteins (isoelectric point calculated using IPC2_protein)
Get csv file with sequences according to given criteria:
* You can choose from 21 different methods for calculating isoelectric point
Summary statistics related to proteome-wise predictions


Protein with the lowest isoelectric point:
>tr|A0A2N7D587|A0A2N7D587_9VIBR Formate transporter OS=Vibrio sp. 10N.286.49.C2 OX=1880856 GN=BCU70_16395 PE=4 SV=1
MM1 pKa = 7.67HH2 pKa = 6.55STKK5 pKa = 9.77LTALAGIIAFTLTGCGGEE23 pKa = 4.46SGSDD27 pKa = 3.39SPTSTTPFTLSVTDD41 pKa = 4.81APVDD45 pKa = 3.63DD46 pKa = 4.74AKK48 pKa = 11.17EE49 pKa = 3.93VVITFGKK56 pKa = 10.24VALLPQDD63 pKa = 3.62GGSPLIYY70 pKa = 10.15DD71 pKa = 4.23VYY73 pKa = 10.81LTDD76 pKa = 5.52DD77 pKa = 3.69EE78 pKa = 5.05GNPVDD83 pKa = 4.66EE84 pKa = 5.1SGEE87 pKa = 4.01LLPDD91 pKa = 3.94GADD94 pKa = 3.68TIPLSVNLLDD104 pKa = 4.23YY105 pKa = 10.84QGSASLPLIQDD116 pKa = 3.36QVVLTGRR123 pKa = 11.84YY124 pKa = 8.39KK125 pKa = 11.0LCVFANDD132 pKa = 4.09GDD134 pKa = 4.58HH135 pKa = 6.43PTHH138 pKa = 6.81RR139 pKa = 11.84SYY141 pKa = 11.84VVVDD145 pKa = 3.6EE146 pKa = 5.81DD147 pKa = 3.96EE148 pKa = 4.44TPEE151 pKa = 3.98NHH153 pKa = 7.2PGLSVKK159 pKa = 10.62GDD161 pKa = 3.66GACPQGVGKK170 pKa = 9.9EE171 pKa = 4.08DD172 pKa = 3.38KK173 pKa = 11.28AGVLYY178 pKa = 10.35FNNTFNVNADD188 pKa = 3.61NNDD191 pKa = 3.29FAVEE195 pKa = 4.04FDD197 pKa = 3.84LRR199 pKa = 11.84RR200 pKa = 11.84GLKK203 pKa = 9.84DD204 pKa = 3.21ASSAPDD210 pKa = 3.27YY211 pKa = 9.89TIQRR215 pKa = 11.84TSVSLINTVTTGNIEE230 pKa = 4.12GTIDD234 pKa = 3.18TATFSTCHH242 pKa = 5.61PQEE245 pKa = 5.01DD246 pKa = 4.25LTSVQSVYY254 pKa = 10.83LYY256 pKa = 10.67NSNVAQEE263 pKa = 4.03NMAPIGGSDD272 pKa = 3.43EE273 pKa = 4.75SKK275 pKa = 10.34PLTSASVNWNEE286 pKa = 3.93SLAAYY291 pKa = 7.25TFSFGFMEE299 pKa = 4.82PGSYY303 pKa = 10.66NLGYY307 pKa = 8.78TCTAQFDD314 pKa = 4.33GGEE317 pKa = 4.2EE318 pKa = 3.94NHH320 pKa = 7.09DD321 pKa = 3.53PVAAGFSIYY330 pKa = 10.43DD331 pKa = 3.59SQSDD335 pKa = 3.73VTVAVGKK342 pKa = 8.19DD343 pKa = 3.31TKK345 pKa = 11.27VLFF348 pKa = 4.4
MM1 pKa = 7.67HH2 pKa = 6.55STKK5 pKa = 9.77LTALAGIIAFTLTGCGGEE23 pKa = 4.46SGSDD27 pKa = 3.39SPTSTTPFTLSVTDD41 pKa = 4.81APVDD45 pKa = 3.63DD46 pKa = 4.74AKK48 pKa = 11.17EE49 pKa = 3.93VVITFGKK56 pKa = 10.24VALLPQDD63 pKa = 3.62GGSPLIYY70 pKa = 10.15DD71 pKa = 4.23VYY73 pKa = 10.81LTDD76 pKa = 5.52DD77 pKa = 3.69EE78 pKa = 5.05GNPVDD83 pKa = 4.66EE84 pKa = 5.1SGEE87 pKa = 4.01LLPDD91 pKa = 3.94GADD94 pKa = 3.68TIPLSVNLLDD104 pKa = 4.23YY105 pKa = 10.84QGSASLPLIQDD116 pKa = 3.36QVVLTGRR123 pKa = 11.84YY124 pKa = 8.39KK125 pKa = 11.0LCVFANDD132 pKa = 4.09GDD134 pKa = 4.58HH135 pKa = 6.43PTHH138 pKa = 6.81RR139 pKa = 11.84SYY141 pKa = 11.84VVVDD145 pKa = 3.6EE146 pKa = 5.81DD147 pKa = 3.96EE148 pKa = 4.44TPEE151 pKa = 3.98NHH153 pKa = 7.2PGLSVKK159 pKa = 10.62GDD161 pKa = 3.66GACPQGVGKK170 pKa = 9.9EE171 pKa = 4.08DD172 pKa = 3.38KK173 pKa = 11.28AGVLYY178 pKa = 10.35FNNTFNVNADD188 pKa = 3.61NNDD191 pKa = 3.29FAVEE195 pKa = 4.04FDD197 pKa = 3.84LRR199 pKa = 11.84RR200 pKa = 11.84GLKK203 pKa = 9.84DD204 pKa = 3.21ASSAPDD210 pKa = 3.27YY211 pKa = 9.89TIQRR215 pKa = 11.84TSVSLINTVTTGNIEE230 pKa = 4.12GTIDD234 pKa = 3.18TATFSTCHH242 pKa = 5.61PQEE245 pKa = 5.01DD246 pKa = 4.25LTSVQSVYY254 pKa = 10.83LYY256 pKa = 10.67NSNVAQEE263 pKa = 4.03NMAPIGGSDD272 pKa = 3.43EE273 pKa = 4.75SKK275 pKa = 10.34PLTSASVNWNEE286 pKa = 3.93SLAAYY291 pKa = 7.25TFSFGFMEE299 pKa = 4.82PGSYY303 pKa = 10.66NLGYY307 pKa = 8.78TCTAQFDD314 pKa = 4.33GGEE317 pKa = 4.2EE318 pKa = 3.94NHH320 pKa = 7.09DD321 pKa = 3.53PVAAGFSIYY330 pKa = 10.43DD331 pKa = 3.59SQSDD335 pKa = 3.73VTVAVGKK342 pKa = 8.19DD343 pKa = 3.31TKK345 pKa = 11.27VLFF348 pKa = 4.4
Molecular weight: 36.92 kDa
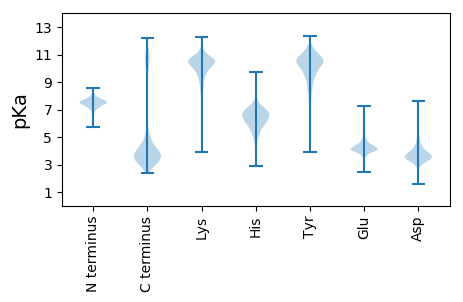
Isoelectric point according different methods:
Protein with the highest isoelectric point:
>tr|A0A2N7D483|A0A2N7D483_9VIBR tRNA modification GTPase MnmE OS=Vibrio sp. 10N.286.49.C2 OX=1880856 GN=mnmE PE=3 SV=1
MM1 pKa = 7.69SKK3 pKa = 8.98RR4 pKa = 11.84TFQPSVLKK12 pKa = 10.49RR13 pKa = 11.84KK14 pKa = 7.97RR15 pKa = 11.84THH17 pKa = 5.89GFRR20 pKa = 11.84ARR22 pKa = 11.84MATKK26 pKa = 10.46NGRR29 pKa = 11.84KK30 pKa = 7.78TINARR35 pKa = 11.84RR36 pKa = 11.84AKK38 pKa = 10.22GRR40 pKa = 11.84ARR42 pKa = 11.84LSKK45 pKa = 10.83
MM1 pKa = 7.69SKK3 pKa = 8.98RR4 pKa = 11.84TFQPSVLKK12 pKa = 10.49RR13 pKa = 11.84KK14 pKa = 7.97RR15 pKa = 11.84THH17 pKa = 5.89GFRR20 pKa = 11.84ARR22 pKa = 11.84MATKK26 pKa = 10.46NGRR29 pKa = 11.84KK30 pKa = 7.78TINARR35 pKa = 11.84RR36 pKa = 11.84AKK38 pKa = 10.22GRR40 pKa = 11.84ARR42 pKa = 11.84LSKK45 pKa = 10.83
Molecular weight: 5.26 kDa
Isoelectric point according different methods:
Peptides (in silico digests for buttom-up proteomics)
Below you can find in silico digests of the whole proteome with Trypsin, Chymotrypsin, Trypsin+LysC, LysN, ArgC proteases suitable for different mass spec machines.| Try ESI |
 |
|---|
| ChTry ESI |
 |
|---|
| ArgC ESI |
 |
|---|
| LysN ESI |
 |
|---|
| TryLysC ESI |
 |
|---|
| Try MALDI |
 |
|---|
| ChTry MALDI |
 |
|---|
| ArgC MALDI |
 |
|---|
| LysN MALDI |
 |
|---|
| TryLysC MALDI |
 |
|---|
| Try LTQ |
 |
|---|
| ChTry LTQ |
 |
|---|
| ArgC LTQ |
 |
|---|
| LysN LTQ |
 |
|---|
| TryLysC LTQ |
 |
|---|
| Try MSlow |
 |
|---|
| ChTry MSlow |
 |
|---|
| ArgC MSlow |
 |
|---|
| LysN MSlow |
 |
|---|
| TryLysC MSlow |
 |
|---|
| Try MShigh |
 |
|---|
| ChTry MShigh |
 |
|---|
| ArgC MShigh |
 |
|---|
| LysN MShigh |
 |
|---|
| TryLysC MShigh |
 |
|---|
General Statistics
Number of major isoforms |
Number of additional isoforms |
Number of all proteins |
Number of amino acids |
Min. Seq. Length |
Max. Seq. Length |
Avg. Seq. Length |
Avg. Mol. Weight |
|---|---|---|---|---|---|---|---|
0 |
1422617 |
35 |
4079 |
327.9 |
36.37 |
Amino acid frequency
Ala |
Cys |
Asp |
Glu |
Phe |
Gly |
His |
Ile |
Lys |
Leu |
|---|---|---|---|---|---|---|---|---|---|
8.502 ± 0.036 | 1.004 ± 0.011 |
5.655 ± 0.043 | 6.067 ± 0.033 |
4.16 ± 0.027 | 6.941 ± 0.039 |
2.301 ± 0.018 | 6.471 ± 0.031 |
5.106 ± 0.03 | 10.152 ± 0.046 |
Met |
Asn |
Gln |
Pro |
Arg |
Ser |
Thr |
Val |
Trp |
Tyr |
|---|---|---|---|---|---|---|---|---|---|
2.759 ± 0.022 | 4.273 ± 0.026 |
3.867 ± 0.025 | 4.387 ± 0.028 |
4.401 ± 0.029 | 6.787 ± 0.03 |
5.629 ± 0.032 | 7.221 ± 0.031 |
1.278 ± 0.018 | 3.039 ± 0.022 |
Most of the basic statistics you can see at this page can be downloaded from this CSV file
Proteome-pI is available under Creative Commons Attribution-NoDerivs license, for more details see here
| Reference: Kozlowski LP. Proteome-pI 2.0: Proteome Isoelectric Point Database Update. Nucleic Acids Res. 2021, doi: 10.1093/nar/gkab944 | Contact: Lukasz P. Kozlowski |
