Sphingobacterium gobiense
Taxonomy: cellular organisms; Bacteria; FCB group; Bacteroidetes/Chlorobi group; Bacteroidetes; Sphingobacteriia; Sphingobacteriales; Sphingobacteriaceae; Sphingobacterium
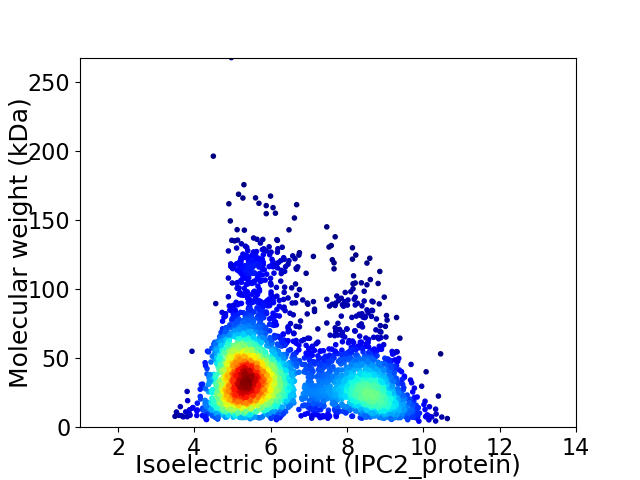
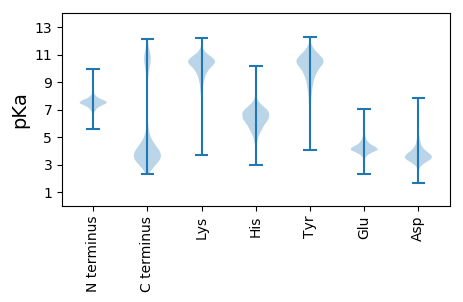
Average proteome isoelectric point is 6.35
Get precalculated fractions of proteins

Virtual 2D-PAGE plot for 3791 proteins (isoelectric point calculated using IPC2_protein)
Get csv file with sequences according to given criteria:
* You can choose from 21 different methods for calculating isoelectric point
Summary statistics related to proteome-wise predictions


Protein with the lowest isoelectric point:
>tr|A0A2S9JLN8|A0A2S9JLN8_9SPHI Uncharacterized protein OS=Sphingobacterium gobiense OX=1382456 GN=C5749_11240 PE=4 SV=1
MM1 pKa = 6.97YY2 pKa = 10.36RR3 pKa = 11.84SILALLLSFSFSTVFSQEE21 pKa = 3.72KK22 pKa = 10.15LFKK25 pKa = 9.7IDD27 pKa = 3.41YY28 pKa = 9.75KK29 pKa = 10.98LALSSEE35 pKa = 4.54TLTQTDD41 pKa = 3.6TTEE44 pKa = 4.73DD45 pKa = 3.35NSLDD49 pKa = 3.93LLSALAAAFGEE60 pKa = 4.45DD61 pKa = 4.4DD62 pKa = 3.98TPQVQAWVNQNFIRR76 pKa = 11.84VEE78 pKa = 4.21TQGITQNNQIQITNRR93 pKa = 11.84NTEE96 pKa = 4.22DD97 pKa = 3.63SYY99 pKa = 11.67MLYY102 pKa = 10.39PSMQAYY108 pKa = 7.44TKK110 pKa = 10.15TADD113 pKa = 3.31ATDD116 pKa = 3.27KK117 pKa = 11.41VNIHH121 pKa = 5.64EE122 pKa = 4.51TEE124 pKa = 4.13DD125 pKa = 4.75DD126 pKa = 3.48ITVTSTADD134 pKa = 3.25LPIRR138 pKa = 11.84FVADD142 pKa = 3.36TSKK145 pKa = 10.03TIAGLLCKK153 pKa = 10.25LAVLEE158 pKa = 4.28FDD160 pKa = 3.56SDD162 pKa = 3.84EE163 pKa = 4.5FNAALPQDD171 pKa = 3.53TRR173 pKa = 11.84LEE175 pKa = 3.56IWYY178 pKa = 10.03NEE180 pKa = 4.28SLPSLYY186 pKa = 9.53WGEE189 pKa = 3.8YY190 pKa = 10.27AYY192 pKa = 11.12LKK194 pKa = 9.93NIPGAALYY202 pKa = 10.1IGAFGIGIEE211 pKa = 4.27ASAIDD216 pKa = 5.22EE217 pKa = 4.26IDD219 pKa = 3.61FDD221 pKa = 4.45PSLFEE226 pKa = 4.12IPEE229 pKa = 4.55DD230 pKa = 3.56YY231 pKa = 10.39TLQEE235 pKa = 4.12NIYY238 pKa = 9.63ALSFFDD244 pKa = 4.71MPLGHH249 pKa = 6.75NLYY252 pKa = 10.49AFQDD256 pKa = 4.12STSHH260 pKa = 7.41LIGIRR265 pKa = 11.84DD266 pKa = 4.0DD267 pKa = 3.77SQQVIVEE274 pKa = 4.26PKK276 pKa = 8.2YY277 pKa = 10.61ASINEE282 pKa = 4.54FIGTRR287 pKa = 11.84AIVTNPDD294 pKa = 3.14FQYY297 pKa = 11.33GIIDD301 pKa = 3.39INGQEE306 pKa = 4.23VVPCTWEE313 pKa = 3.88YY314 pKa = 11.21LALDD318 pKa = 4.21PEE320 pKa = 4.5LEE322 pKa = 4.48IIFFSIDD329 pKa = 2.95GKK331 pKa = 9.46TGVMDD336 pKa = 3.92YY337 pKa = 10.93NRR339 pKa = 11.84EE340 pKa = 4.05TLIPAQYY347 pKa = 10.9DD348 pKa = 3.65HH349 pKa = 7.34ISFFSKK355 pKa = 10.47DD356 pKa = 3.42YY357 pKa = 11.61ALFSEE362 pKa = 4.77DD363 pKa = 4.15GKK365 pKa = 9.65TGLIDD370 pKa = 4.24LDD372 pKa = 4.09GKK374 pKa = 10.59IVLPAVFEE382 pKa = 4.67TIMEE386 pKa = 4.19YY387 pKa = 10.8DD388 pKa = 3.74EE389 pKa = 4.44SHH391 pKa = 7.04VIIIEE396 pKa = 3.82NEE398 pKa = 3.49RR399 pKa = 11.84YY400 pKa = 9.51YY401 pKa = 11.36VVDD404 pKa = 3.22IQSQQKK410 pKa = 6.22TTAGHH415 pKa = 7.41DD416 pKa = 3.7YY417 pKa = 11.26LLLANEE423 pKa = 4.39GDD425 pKa = 4.15LVVALQDD432 pKa = 3.43NKK434 pKa = 10.95YY435 pKa = 11.09GYY437 pKa = 7.88ITKK440 pKa = 9.89DD441 pKa = 3.08GKK443 pKa = 10.35IAIPFKK449 pKa = 11.04YY450 pKa = 10.04EE451 pKa = 3.76YY452 pKa = 9.0ATPFYY457 pKa = 11.11DD458 pKa = 5.78GIAAINEE465 pKa = 4.03TDD467 pKa = 4.5DD468 pKa = 6.36DD469 pKa = 4.32DD470 pKa = 4.37VLYY473 pKa = 10.54INTKK477 pKa = 9.23GEE479 pKa = 4.11YY480 pKa = 8.86VQVEE484 pKa = 4.27EE485 pKa = 4.83TEE487 pKa = 4.04
MM1 pKa = 6.97YY2 pKa = 10.36RR3 pKa = 11.84SILALLLSFSFSTVFSQEE21 pKa = 3.72KK22 pKa = 10.15LFKK25 pKa = 9.7IDD27 pKa = 3.41YY28 pKa = 9.75KK29 pKa = 10.98LALSSEE35 pKa = 4.54TLTQTDD41 pKa = 3.6TTEE44 pKa = 4.73DD45 pKa = 3.35NSLDD49 pKa = 3.93LLSALAAAFGEE60 pKa = 4.45DD61 pKa = 4.4DD62 pKa = 3.98TPQVQAWVNQNFIRR76 pKa = 11.84VEE78 pKa = 4.21TQGITQNNQIQITNRR93 pKa = 11.84NTEE96 pKa = 4.22DD97 pKa = 3.63SYY99 pKa = 11.67MLYY102 pKa = 10.39PSMQAYY108 pKa = 7.44TKK110 pKa = 10.15TADD113 pKa = 3.31ATDD116 pKa = 3.27KK117 pKa = 11.41VNIHH121 pKa = 5.64EE122 pKa = 4.51TEE124 pKa = 4.13DD125 pKa = 4.75DD126 pKa = 3.48ITVTSTADD134 pKa = 3.25LPIRR138 pKa = 11.84FVADD142 pKa = 3.36TSKK145 pKa = 10.03TIAGLLCKK153 pKa = 10.25LAVLEE158 pKa = 4.28FDD160 pKa = 3.56SDD162 pKa = 3.84EE163 pKa = 4.5FNAALPQDD171 pKa = 3.53TRR173 pKa = 11.84LEE175 pKa = 3.56IWYY178 pKa = 10.03NEE180 pKa = 4.28SLPSLYY186 pKa = 9.53WGEE189 pKa = 3.8YY190 pKa = 10.27AYY192 pKa = 11.12LKK194 pKa = 9.93NIPGAALYY202 pKa = 10.1IGAFGIGIEE211 pKa = 4.27ASAIDD216 pKa = 5.22EE217 pKa = 4.26IDD219 pKa = 3.61FDD221 pKa = 4.45PSLFEE226 pKa = 4.12IPEE229 pKa = 4.55DD230 pKa = 3.56YY231 pKa = 10.39TLQEE235 pKa = 4.12NIYY238 pKa = 9.63ALSFFDD244 pKa = 4.71MPLGHH249 pKa = 6.75NLYY252 pKa = 10.49AFQDD256 pKa = 4.12STSHH260 pKa = 7.41LIGIRR265 pKa = 11.84DD266 pKa = 4.0DD267 pKa = 3.77SQQVIVEE274 pKa = 4.26PKK276 pKa = 8.2YY277 pKa = 10.61ASINEE282 pKa = 4.54FIGTRR287 pKa = 11.84AIVTNPDD294 pKa = 3.14FQYY297 pKa = 11.33GIIDD301 pKa = 3.39INGQEE306 pKa = 4.23VVPCTWEE313 pKa = 3.88YY314 pKa = 11.21LALDD318 pKa = 4.21PEE320 pKa = 4.5LEE322 pKa = 4.48IIFFSIDD329 pKa = 2.95GKK331 pKa = 9.46TGVMDD336 pKa = 3.92YY337 pKa = 10.93NRR339 pKa = 11.84EE340 pKa = 4.05TLIPAQYY347 pKa = 10.9DD348 pKa = 3.65HH349 pKa = 7.34ISFFSKK355 pKa = 10.47DD356 pKa = 3.42YY357 pKa = 11.61ALFSEE362 pKa = 4.77DD363 pKa = 4.15GKK365 pKa = 9.65TGLIDD370 pKa = 4.24LDD372 pKa = 4.09GKK374 pKa = 10.59IVLPAVFEE382 pKa = 4.67TIMEE386 pKa = 4.19YY387 pKa = 10.8DD388 pKa = 3.74EE389 pKa = 4.44SHH391 pKa = 7.04VIIIEE396 pKa = 3.82NEE398 pKa = 3.49RR399 pKa = 11.84YY400 pKa = 9.51YY401 pKa = 11.36VVDD404 pKa = 3.22IQSQQKK410 pKa = 6.22TTAGHH415 pKa = 7.41DD416 pKa = 3.7YY417 pKa = 11.26LLLANEE423 pKa = 4.39GDD425 pKa = 4.15LVVALQDD432 pKa = 3.43NKK434 pKa = 10.95YY435 pKa = 11.09GYY437 pKa = 7.88ITKK440 pKa = 9.89DD441 pKa = 3.08GKK443 pKa = 10.35IAIPFKK449 pKa = 11.04YY450 pKa = 10.04EE451 pKa = 3.76YY452 pKa = 9.0ATPFYY457 pKa = 11.11DD458 pKa = 5.78GIAAINEE465 pKa = 4.03TDD467 pKa = 4.5DD468 pKa = 6.36DD469 pKa = 4.32DD470 pKa = 4.37VLYY473 pKa = 10.54INTKK477 pKa = 9.23GEE479 pKa = 4.11YY480 pKa = 8.86VQVEE484 pKa = 4.27EE485 pKa = 4.83TEE487 pKa = 4.04
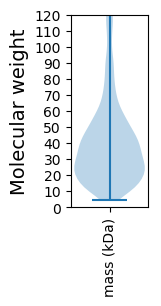
Molecular weight: 55.02 kDa
Isoelectric point according different methods:
Protein with the highest isoelectric point:
>tr|A0A2S9JGL5|A0A2S9JGL5_9SPHI Diadenylate cyclase OS=Sphingobacterium gobiense OX=1382456 GN=dacA PE=3 SV=1
MM1 pKa = 7.55GFYY4 pKa = 10.28IPQKK8 pKa = 10.11FGWTIKK14 pKa = 10.29VKK16 pKa = 10.46EE17 pKa = 4.39GLVQSCSGSDD27 pKa = 3.42SARR30 pKa = 11.84LSIADD35 pKa = 3.69GVASRR40 pKa = 11.84SPYY43 pKa = 8.44QWRR46 pKa = 11.84ADD48 pKa = 3.71KK49 pKa = 11.27DD50 pKa = 3.93NAWGFEE56 pKa = 3.73RR57 pKa = 11.84RR58 pKa = 11.84EE59 pKa = 3.69RR60 pKa = 11.84HH61 pKa = 5.71HH62 pKa = 7.15NYY64 pKa = 9.95DD65 pKa = 3.44RR66 pKa = 11.84NPPQRR71 pKa = 11.84VSIVILALTSIARR84 pKa = 11.84VRR86 pKa = 11.84DD87 pKa = 3.45GLVRR91 pKa = 11.84RR92 pKa = 11.84ATT94 pKa = 3.42
MM1 pKa = 7.55GFYY4 pKa = 10.28IPQKK8 pKa = 10.11FGWTIKK14 pKa = 10.29VKK16 pKa = 10.46EE17 pKa = 4.39GLVQSCSGSDD27 pKa = 3.42SARR30 pKa = 11.84LSIADD35 pKa = 3.69GVASRR40 pKa = 11.84SPYY43 pKa = 8.44QWRR46 pKa = 11.84ADD48 pKa = 3.71KK49 pKa = 11.27DD50 pKa = 3.93NAWGFEE56 pKa = 3.73RR57 pKa = 11.84RR58 pKa = 11.84EE59 pKa = 3.69RR60 pKa = 11.84HH61 pKa = 5.71HH62 pKa = 7.15NYY64 pKa = 9.95DD65 pKa = 3.44RR66 pKa = 11.84NPPQRR71 pKa = 11.84VSIVILALTSIARR84 pKa = 11.84VRR86 pKa = 11.84DD87 pKa = 3.45GLVRR91 pKa = 11.84RR92 pKa = 11.84ATT94 pKa = 3.42
Molecular weight: 10.72 kDa
Isoelectric point according different methods:
Peptides (in silico digests for buttom-up proteomics)
Below you can find in silico digests of the whole proteome with Trypsin, Chymotrypsin, Trypsin+LysC, LysN, ArgC proteases suitable for different mass spec machines.| Try ESI |
 |
|---|
| ChTry ESI |
 |
|---|
| ArgC ESI |
 |
|---|
| LysN ESI |
 |
|---|
| TryLysC ESI |
 |
|---|
| Try MALDI |
 |
|---|
| ChTry MALDI |
 |
|---|
| ArgC MALDI |
 |
|---|
| LysN MALDI |
 |
|---|
| TryLysC MALDI |
 |
|---|
| Try LTQ |
 |
|---|
| ChTry LTQ |
 |
|---|
| ArgC LTQ |
 |
|---|
| LysN LTQ |
 |
|---|
| TryLysC LTQ |
 |
|---|
| Try MSlow |
 |
|---|
| ChTry MSlow |
 |
|---|
| ArgC MSlow |
 |
|---|
| LysN MSlow |
 |
|---|
| TryLysC MSlow |
 |
|---|
| Try MShigh |
 |
|---|
| ChTry MShigh |
 |
|---|
| ArgC MShigh |
 |
|---|
| LysN MShigh |
 |
|---|
| TryLysC MShigh |
 |
|---|
General Statistics
Number of major isoforms |
Number of additional isoforms |
Number of all proteins |
Number of amino acids |
Min. Seq. Length |
Max. Seq. Length |
Avg. Seq. Length |
Avg. Mol. Weight |
|---|---|---|---|---|---|---|---|
0 |
1386281 |
38 |
2439 |
365.7 |
41.23 |
Amino acid frequency
Ala |
Cys |
Asp |
Glu |
Phe |
Gly |
His |
Ile |
Lys |
Leu |
|---|---|---|---|---|---|---|---|---|---|
7.198 ± 0.042 | 0.719 ± 0.011 |
5.701 ± 0.025 | 6.274 ± 0.034 |
4.804 ± 0.031 | 6.929 ± 0.04 |
2.036 ± 0.02 | 7.053 ± 0.035 |
6.207 ± 0.038 | 9.352 ± 0.041 |
Met |
Asn |
Gln |
Pro |
Arg |
Ser |
Thr |
Val |
Trp |
Tyr |
|---|---|---|---|---|---|---|---|---|---|
2.333 ± 0.016 | 5.318 ± 0.037 |
3.724 ± 0.02 | 3.813 ± 0.022 |
4.671 ± 0.026 | 6.138 ± 0.031 |
5.606 ± 0.022 | 6.531 ± 0.024 |
1.298 ± 0.015 | 4.296 ± 0.024 |
Most of the basic statistics you can see at this page can be downloaded from this CSV file
Proteome-pI is available under Creative Commons Attribution-NoDerivs license, for more details see here
| Reference: Kozlowski LP. Proteome-pI 2.0: Proteome Isoelectric Point Database Update. Nucleic Acids Res. 2021, doi: 10.1093/nar/gkab944 | Contact: Lukasz P. Kozlowski |
