Algoriphagus kandeliae
Taxonomy: cellular organisms; Bacteria; FCB group; Bacteroidetes/Chlorobi group; Bacteroidetes; Cytophagia; Cytophagales; Cyclobacteriaceae; Algoriphagus
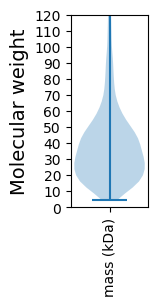
Average proteome isoelectric point is 6.09
Get precalculated fractions of proteins

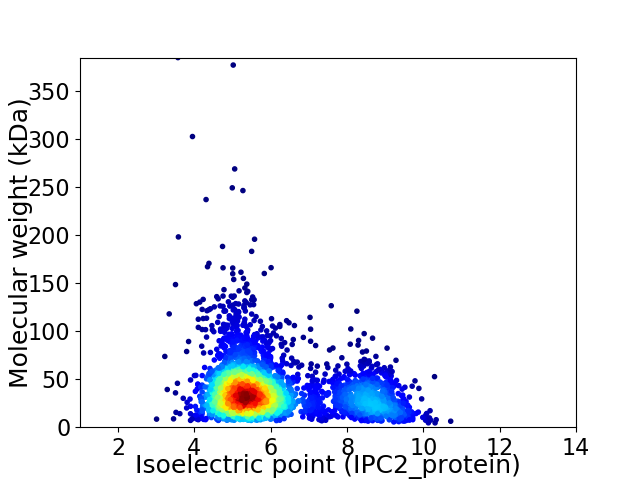
Virtual 2D-PAGE plot for 3350 proteins (isoelectric point calculated using IPC2_protein)
Get csv file with sequences according to given criteria:
* You can choose from 21 different methods for calculating isoelectric point
Summary statistics related to proteome-wise predictions


Protein with the lowest isoelectric point:
>tr|A0A4Y9QZC7|A0A4Y9QZC7_9BACT Metal ABC transporter permease OS=Algoriphagus kandeliae OX=2562278 GN=E4S40_02985 PE=3 SV=1
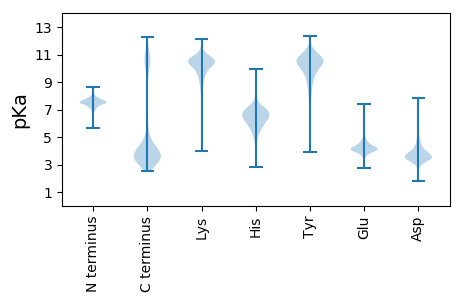
MM1 pKa = 7.66AFLIFSCDD9 pKa = 3.27KK10 pKa = 10.36EE11 pKa = 4.69VEE13 pKa = 4.45VPGGGAAFDD22 pKa = 4.68CNQLSYY28 pKa = 11.45SDD30 pKa = 3.7TIYY33 pKa = 10.93YY34 pKa = 10.03ISATQSVLVSPQTNLEE50 pKa = 4.07GQGTFEE56 pKa = 4.32VSPDD60 pKa = 3.03GLAIDD65 pKa = 4.39TNTGVIDD72 pKa = 3.8VNASEE77 pKa = 4.62TGLKK81 pKa = 10.38YY82 pKa = 10.68KK83 pKa = 9.37ITFTPTGSNQVCEE96 pKa = 4.28TFVTIGGVNYY106 pKa = 10.54LDD108 pKa = 4.61GIYY111 pKa = 10.85VLDD114 pKa = 4.12QNEE117 pKa = 4.29TLAGPIYY124 pKa = 10.59NGVPGLPLPCPDD136 pKa = 5.38DD137 pKa = 5.8DD138 pKa = 6.08SDD140 pKa = 5.75DD141 pKa = 4.19GSSDD145 pKa = 5.03DD146 pKa = 4.88DD147 pKa = 3.95SCDD150 pKa = 3.51FDD152 pKa = 4.01VEE154 pKa = 4.4NPSGILLEE162 pKa = 4.51DD163 pKa = 3.64LGFEE167 pKa = 4.09ISSKK171 pKa = 10.98GVFDD175 pKa = 4.91LLEE178 pKa = 4.25TVEE181 pKa = 4.56NGTFGAIPVNGEE193 pKa = 3.94SLDD196 pKa = 3.55VEE198 pKa = 5.07LYY200 pKa = 10.92YY201 pKa = 10.82KK202 pKa = 10.92LPDD205 pKa = 3.75LSSNALNSIPLRR217 pKa = 11.84FFYY220 pKa = 11.18YY221 pKa = 9.28EE222 pKa = 4.07TVADD226 pKa = 4.15IPQALLDD233 pKa = 4.99DD234 pKa = 4.48IEE236 pKa = 4.67EE237 pKa = 4.33KK238 pKa = 10.76SDD240 pKa = 4.28LINEE244 pKa = 4.25SRR246 pKa = 11.84SGNSLNFRR254 pKa = 11.84VMNEE258 pKa = 3.64TRR260 pKa = 11.84PRR262 pKa = 11.84RR263 pKa = 11.84VPRR266 pKa = 11.84PPFIVIVARR275 pKa = 11.84LEE277 pKa = 3.93
MM1 pKa = 7.66AFLIFSCDD9 pKa = 3.27KK10 pKa = 10.36EE11 pKa = 4.69VEE13 pKa = 4.45VPGGGAAFDD22 pKa = 4.68CNQLSYY28 pKa = 11.45SDD30 pKa = 3.7TIYY33 pKa = 10.93YY34 pKa = 10.03ISATQSVLVSPQTNLEE50 pKa = 4.07GQGTFEE56 pKa = 4.32VSPDD60 pKa = 3.03GLAIDD65 pKa = 4.39TNTGVIDD72 pKa = 3.8VNASEE77 pKa = 4.62TGLKK81 pKa = 10.38YY82 pKa = 10.68KK83 pKa = 9.37ITFTPTGSNQVCEE96 pKa = 4.28TFVTIGGVNYY106 pKa = 10.54LDD108 pKa = 4.61GIYY111 pKa = 10.85VLDD114 pKa = 4.12QNEE117 pKa = 4.29TLAGPIYY124 pKa = 10.59NGVPGLPLPCPDD136 pKa = 5.38DD137 pKa = 5.8DD138 pKa = 6.08SDD140 pKa = 5.75DD141 pKa = 4.19GSSDD145 pKa = 5.03DD146 pKa = 4.88DD147 pKa = 3.95SCDD150 pKa = 3.51FDD152 pKa = 4.01VEE154 pKa = 4.4NPSGILLEE162 pKa = 4.51DD163 pKa = 3.64LGFEE167 pKa = 4.09ISSKK171 pKa = 10.98GVFDD175 pKa = 4.91LLEE178 pKa = 4.25TVEE181 pKa = 4.56NGTFGAIPVNGEE193 pKa = 3.94SLDD196 pKa = 3.55VEE198 pKa = 5.07LYY200 pKa = 10.92YY201 pKa = 10.82KK202 pKa = 10.92LPDD205 pKa = 3.75LSSNALNSIPLRR217 pKa = 11.84FFYY220 pKa = 11.18YY221 pKa = 9.28EE222 pKa = 4.07TVADD226 pKa = 4.15IPQALLDD233 pKa = 4.99DD234 pKa = 4.48IEE236 pKa = 4.67EE237 pKa = 4.33KK238 pKa = 10.76SDD240 pKa = 4.28LINEE244 pKa = 4.25SRR246 pKa = 11.84SGNSLNFRR254 pKa = 11.84VMNEE258 pKa = 3.64TRR260 pKa = 11.84PRR262 pKa = 11.84RR263 pKa = 11.84VPRR266 pKa = 11.84PPFIVIVARR275 pKa = 11.84LEE277 pKa = 3.93
Molecular weight: 30.08 kDa
Isoelectric point according different methods:
Protein with the highest isoelectric point:
>tr|A0A4Y9QI78|A0A4Y9QI78_9BACT Ligase-associated DNA damage response exonuclease OS=Algoriphagus kandeliae OX=2562278 GN=E4S40_16250 PE=4 SV=1
MM1 pKa = 7.45KK2 pKa = 9.56RR3 pKa = 11.84TFQPSRR9 pKa = 11.84RR10 pKa = 11.84KK11 pKa = 9.77RR12 pKa = 11.84KK13 pKa = 8.25NKK15 pKa = 9.37HH16 pKa = 4.12GFRR19 pKa = 11.84EE20 pKa = 4.15RR21 pKa = 11.84MSTANGRR28 pKa = 11.84RR29 pKa = 11.84VLKK32 pKa = 10.53ARR34 pKa = 11.84RR35 pKa = 11.84AKK37 pKa = 10.05GRR39 pKa = 11.84KK40 pKa = 8.51KK41 pKa = 10.08LTVSSEE47 pKa = 3.96KK48 pKa = 9.88TLKK51 pKa = 10.51KK52 pKa = 10.72
MM1 pKa = 7.45KK2 pKa = 9.56RR3 pKa = 11.84TFQPSRR9 pKa = 11.84RR10 pKa = 11.84KK11 pKa = 9.77RR12 pKa = 11.84KK13 pKa = 8.25NKK15 pKa = 9.37HH16 pKa = 4.12GFRR19 pKa = 11.84EE20 pKa = 4.15RR21 pKa = 11.84MSTANGRR28 pKa = 11.84RR29 pKa = 11.84VLKK32 pKa = 10.53ARR34 pKa = 11.84RR35 pKa = 11.84AKK37 pKa = 10.05GRR39 pKa = 11.84KK40 pKa = 8.51KK41 pKa = 10.08LTVSSEE47 pKa = 3.96KK48 pKa = 9.88TLKK51 pKa = 10.51KK52 pKa = 10.72
Molecular weight: 6.23 kDa
Isoelectric point according different methods:
Peptides (in silico digests for buttom-up proteomics)
Below you can find in silico digests of the whole proteome with Trypsin, Chymotrypsin, Trypsin+LysC, LysN, ArgC proteases suitable for different mass spec machines.| Try ESI |
 |
|---|
| ChTry ESI |
 |
|---|
| ArgC ESI |
 |
|---|
| LysN ESI |
 |
|---|
| TryLysC ESI |
 |
|---|
| Try MALDI |
 |
|---|
| ChTry MALDI |
 |
|---|
| ArgC MALDI |
 |
|---|
| LysN MALDI |
 |
|---|
| TryLysC MALDI |
 |
|---|
| Try LTQ |
 |
|---|
| ChTry LTQ |
 |
|---|
| ArgC LTQ |
 |
|---|
| LysN LTQ |
 |
|---|
| TryLysC LTQ |
 |
|---|
| Try MSlow |
 |
|---|
| ChTry MSlow |
 |
|---|
| ArgC MSlow |
 |
|---|
| LysN MSlow |
 |
|---|
| TryLysC MSlow |
 |
|---|
| Try MShigh |
 |
|---|
| ChTry MShigh |
 |
|---|
| ArgC MShigh |
 |
|---|
| LysN MShigh |
 |
|---|
| TryLysC MShigh |
 |
|---|
General Statistics
Number of major isoforms |
Number of additional isoforms |
Number of all proteins |
Number of amino acids |
Min. Seq. Length |
Max. Seq. Length |
Avg. Seq. Length |
Avg. Mol. Weight |
|---|---|---|---|---|---|---|---|
0 |
1196724 |
38 |
3576 |
357.2 |
40.28 |
Amino acid frequency
Ala |
Cys |
Asp |
Glu |
Phe |
Gly |
His |
Ile |
Lys |
Leu |
|---|---|---|---|---|---|---|---|---|---|
6.578 ± 0.043 | 0.633 ± 0.013 |
5.368 ± 0.031 | 7.343 ± 0.039 |
5.491 ± 0.032 | 7.164 ± 0.036 |
1.817 ± 0.021 | 7.285 ± 0.036 |
6.547 ± 0.046 | 9.895 ± 0.048 |
Met |
Asn |
Gln |
Pro |
Arg |
Ser |
Thr |
Val |
Trp |
Tyr |
|---|---|---|---|---|---|---|---|---|---|
2.299 ± 0.025 | 4.893 ± 0.038 |
4.124 ± 0.026 | 3.928 ± 0.029 |
4.171 ± 0.03 | 6.55 ± 0.031 |
4.834 ± 0.032 | 6.085 ± 0.032 |
1.323 ± 0.018 | 3.67 ± 0.025 |
Most of the basic statistics you can see at this page can be downloaded from this CSV file
Proteome-pI is available under Creative Commons Attribution-NoDerivs license, for more details see here
| Reference: Kozlowski LP. Proteome-pI 2.0: Proteome Isoelectric Point Database Update. Nucleic Acids Res. 2021, doi: 10.1093/nar/gkab944 | Contact: Lukasz P. Kozlowski |
