Lobosporangium transversale
Taxonomy: cellular organisms; Eukaryota; Opisthokonta; Fungi; Fungi incertae sedis; Mucoromycota; Mortierellomycotina; Mortierellomycetes;
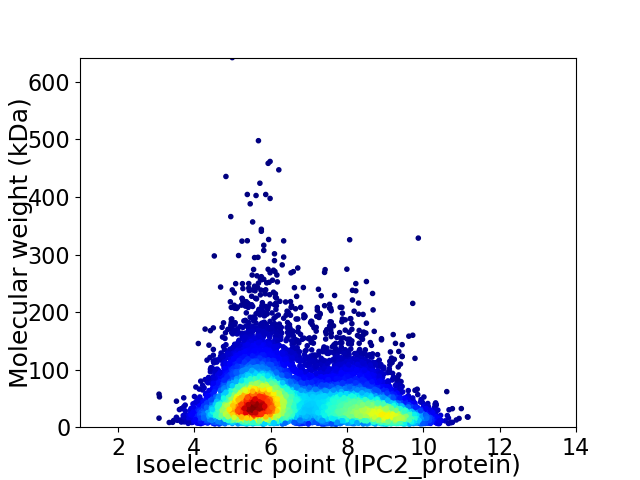
Average proteome isoelectric point is 6.69
Get precalculated fractions of proteins

Virtual 2D-PAGE plot for 11597 proteins (isoelectric point calculated using IPC2_protein)
Get csv file with sequences according to given criteria:
* You can choose from 21 different methods for calculating isoelectric point
Summary statistics related to proteome-wise predictions


Protein with the lowest isoelectric point:
>tr|A0A1Y2GFQ1|A0A1Y2GFQ1_9FUNG DUF3533 domain-containing protein OS=Lobosporangium transversale OX=64571 GN=BCR41DRAFT_424219 PE=4 SV=1
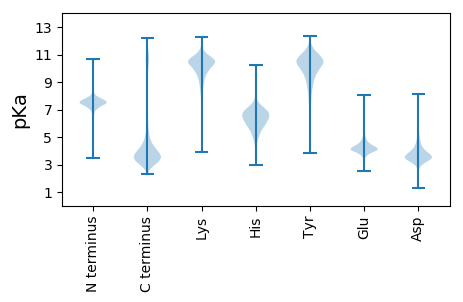
MM1 pKa = 8.26RR2 pKa = 11.84YY3 pKa = 5.43TTYY6 pKa = 10.79TVTLCLLFALLASAAPVPEE25 pKa = 4.2EE26 pKa = 3.76TQEE29 pKa = 4.59QKK31 pKa = 11.24DD32 pKa = 4.33CLDD35 pKa = 3.37QCLTTEE41 pKa = 5.18DD42 pKa = 3.8EE43 pKa = 4.67CLLNSISMSGCVTSYY58 pKa = 10.99DD59 pKa = 3.19EE60 pKa = 4.97CYY62 pKa = 10.59RR63 pKa = 11.84MCIPTTTPTPTSVSAPAPTPGQGQGQPQPQPQPSIPVVSKK103 pKa = 9.85NQKK106 pKa = 9.71HH107 pKa = 6.28KK108 pKa = 11.05DD109 pKa = 3.51VTHH112 pKa = 5.51EE113 pKa = 4.3TEE115 pKa = 3.79ISSPTKK121 pKa = 10.65KK122 pKa = 10.07EE123 pKa = 3.98DD124 pKa = 3.44EE125 pKa = 4.67KK126 pKa = 10.73EE127 pKa = 4.46TEE129 pKa = 4.21EE130 pKa = 3.99QTHH133 pKa = 5.58EE134 pKa = 4.1EE135 pKa = 4.27EE136 pKa = 4.46KK137 pKa = 11.19DD138 pKa = 3.22GDD140 pKa = 3.67VDD142 pKa = 3.61VDD144 pKa = 3.54VDD146 pKa = 3.79VDD148 pKa = 3.59VDD150 pKa = 3.85EE151 pKa = 4.99EE152 pKa = 5.53DD153 pKa = 3.77GDD155 pKa = 4.24FVEE158 pKa = 6.1IPAPPGGEE166 pKa = 3.91DD167 pKa = 3.69DD168 pKa = 4.99EE169 pKa = 5.92EE170 pKa = 6.1YY171 pKa = 11.09DD172 pKa = 5.76DD173 pKa = 5.52EE174 pKa = 6.3PSDD177 pKa = 3.89YY178 pKa = 11.71
MM1 pKa = 8.26RR2 pKa = 11.84YY3 pKa = 5.43TTYY6 pKa = 10.79TVTLCLLFALLASAAPVPEE25 pKa = 4.2EE26 pKa = 3.76TQEE29 pKa = 4.59QKK31 pKa = 11.24DD32 pKa = 4.33CLDD35 pKa = 3.37QCLTTEE41 pKa = 5.18DD42 pKa = 3.8EE43 pKa = 4.67CLLNSISMSGCVTSYY58 pKa = 10.99DD59 pKa = 3.19EE60 pKa = 4.97CYY62 pKa = 10.59RR63 pKa = 11.84MCIPTTTPTPTSVSAPAPTPGQGQGQPQPQPQPSIPVVSKK103 pKa = 9.85NQKK106 pKa = 9.71HH107 pKa = 6.28KK108 pKa = 11.05DD109 pKa = 3.51VTHH112 pKa = 5.51EE113 pKa = 4.3TEE115 pKa = 3.79ISSPTKK121 pKa = 10.65KK122 pKa = 10.07EE123 pKa = 3.98DD124 pKa = 3.44EE125 pKa = 4.67KK126 pKa = 10.73EE127 pKa = 4.46TEE129 pKa = 4.21EE130 pKa = 3.99QTHH133 pKa = 5.58EE134 pKa = 4.1EE135 pKa = 4.27EE136 pKa = 4.46KK137 pKa = 11.19DD138 pKa = 3.22GDD140 pKa = 3.67VDD142 pKa = 3.61VDD144 pKa = 3.54VDD146 pKa = 3.79VDD148 pKa = 3.59VDD150 pKa = 3.85EE151 pKa = 4.99EE152 pKa = 5.53DD153 pKa = 3.77GDD155 pKa = 4.24FVEE158 pKa = 6.1IPAPPGGEE166 pKa = 3.91DD167 pKa = 3.69DD168 pKa = 4.99EE169 pKa = 5.92EE170 pKa = 6.1YY171 pKa = 11.09DD172 pKa = 5.76DD173 pKa = 5.52EE174 pKa = 6.3PSDD177 pKa = 3.89YY178 pKa = 11.71
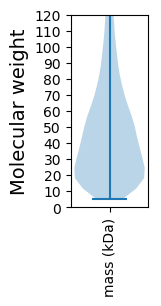
Molecular weight: 19.61 kDa
Isoelectric point according different methods:
Protein with the highest isoelectric point:
>tr|A0A1Y2GY89|A0A1Y2GY89_9FUNG CRAL-TRIO domain-containing protein OS=Lobosporangium transversale OX=64571 GN=BCR41DRAFT_331935 PE=4 SV=1
MM1 pKa = 6.81TTLHH5 pKa = 6.34LQFGLRR11 pKa = 11.84PSHH14 pKa = 6.36PLLRR18 pKa = 11.84RR19 pKa = 11.84VVLPPLLPKK28 pKa = 9.2NTLMTQPQILITHH41 pKa = 7.58LLPSTPIRR49 pKa = 11.84LANANWDD56 pKa = 3.63LPRR59 pKa = 11.84SVNQRR64 pKa = 11.84LPRR67 pKa = 11.84NANRR71 pKa = 11.84RR72 pKa = 11.84LPKK75 pKa = 10.38SKK77 pKa = 10.35NWWLTRR83 pKa = 11.84NVNRR87 pKa = 11.84RR88 pKa = 11.84LPRR91 pKa = 11.84SAGWISIRR99 pKa = 11.84ASWTALALNHH109 pKa = 6.24SSARR113 pKa = 11.84RR114 pKa = 11.84IWVHH118 pKa = 5.86PLFCIRR124 pKa = 11.84TRR126 pKa = 11.84FLMM129 pKa = 4.43
MM1 pKa = 6.81TTLHH5 pKa = 6.34LQFGLRR11 pKa = 11.84PSHH14 pKa = 6.36PLLRR18 pKa = 11.84RR19 pKa = 11.84VVLPPLLPKK28 pKa = 9.2NTLMTQPQILITHH41 pKa = 7.58LLPSTPIRR49 pKa = 11.84LANANWDD56 pKa = 3.63LPRR59 pKa = 11.84SVNQRR64 pKa = 11.84LPRR67 pKa = 11.84NANRR71 pKa = 11.84RR72 pKa = 11.84LPKK75 pKa = 10.38SKK77 pKa = 10.35NWWLTRR83 pKa = 11.84NVNRR87 pKa = 11.84RR88 pKa = 11.84LPRR91 pKa = 11.84SAGWISIRR99 pKa = 11.84ASWTALALNHH109 pKa = 6.24SSARR113 pKa = 11.84RR114 pKa = 11.84IWVHH118 pKa = 5.86PLFCIRR124 pKa = 11.84TRR126 pKa = 11.84FLMM129 pKa = 4.43
Molecular weight: 15.14 kDa
Isoelectric point according different methods:
Peptides (in silico digests for buttom-up proteomics)
Below you can find in silico digests of the whole proteome with Trypsin, Chymotrypsin, Trypsin+LysC, LysN, ArgC proteases suitable for different mass spec machines.| Try ESI |
 |
|---|
| ChTry ESI |
 |
|---|
| ArgC ESI |
 |
|---|
| LysN ESI |
 |
|---|
| TryLysC ESI |
 |
|---|
| Try MALDI |
 |
|---|
| ChTry MALDI |
 |
|---|
| ArgC MALDI |
 |
|---|
| LysN MALDI |
 |
|---|
| TryLysC MALDI |
 |
|---|
| Try LTQ |
 |
|---|
| ChTry LTQ |
 |
|---|
| ArgC LTQ |
 |
|---|
| LysN LTQ |
 |
|---|
| TryLysC LTQ |
 |
|---|
| Try MSlow |
 |
|---|
| ChTry MSlow |
 |
|---|
| ArgC MSlow |
 |
|---|
| LysN MSlow |
 |
|---|
| TryLysC MSlow |
 |
|---|
| Try MShigh |
 |
|---|
| ChTry MShigh |
 |
|---|
| ArgC MShigh |
 |
|---|
| LysN MShigh |
 |
|---|
| TryLysC MShigh |
 |
|---|
General Statistics
Number of major isoforms |
Number of additional isoforms |
Number of all proteins |
Number of amino acids |
Min. Seq. Length |
Max. Seq. Length |
Avg. Seq. Length |
Avg. Mol. Weight |
|---|---|---|---|---|---|---|---|
5469817 |
49 |
5664 |
471.7 |
52.52 |
Amino acid frequency
Ala |
Cys |
Asp |
Glu |
Phe |
Gly |
His |
Ile |
Lys |
Leu |
|---|---|---|---|---|---|---|---|---|---|
7.373 ± 0.02 | 1.244 ± 0.008 |
5.452 ± 0.017 | 6.131 ± 0.027 |
3.651 ± 0.017 | 5.972 ± 0.019 |
2.664 ± 0.013 | 5.485 ± 0.016 |
5.477 ± 0.022 | 8.966 ± 0.032 |
Met |
Asn |
Gln |
Pro |
Arg |
Ser |
Thr |
Val |
Trp |
Tyr |
|---|---|---|---|---|---|---|---|---|---|
2.429 ± 0.009 | 4.431 ± 0.014 |
5.341 ± 0.024 | 4.781 ± 0.026 |
5.444 ± 0.016 | 9.23 ± 0.036 |
6.208 ± 0.016 | 5.757 ± 0.018 |
1.104 ± 0.008 | 2.863 ± 0.013 |
Most of the basic statistics you can see at this page can be downloaded from this CSV file
Proteome-pI is available under Creative Commons Attribution-NoDerivs license, for more details see here
| Reference: Kozlowski LP. Proteome-pI 2.0: Proteome Isoelectric Point Database Update. Nucleic Acids Res. 2021, doi: 10.1093/nar/gkab944 | Contact: Lukasz P. Kozlowski |
