Cucurbit chlorotic yellows virus
Taxonomy: Viruses; Riboviria; Orthornavirae; Kitrinoviricota; Alsuviricetes; Martellivirales; Closteroviridae; Crinivirus; unclassified Crinivirus
Average proteome isoelectric point is 6.41
Get precalculated fractions of proteins
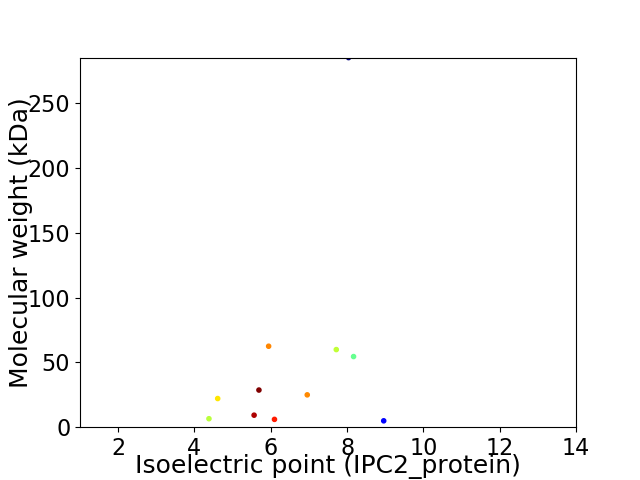
Virtual 2D-PAGE plot for 11 proteins (isoelectric point calculated using IPC2_protein)
Get csv file with sequences according to given criteria:
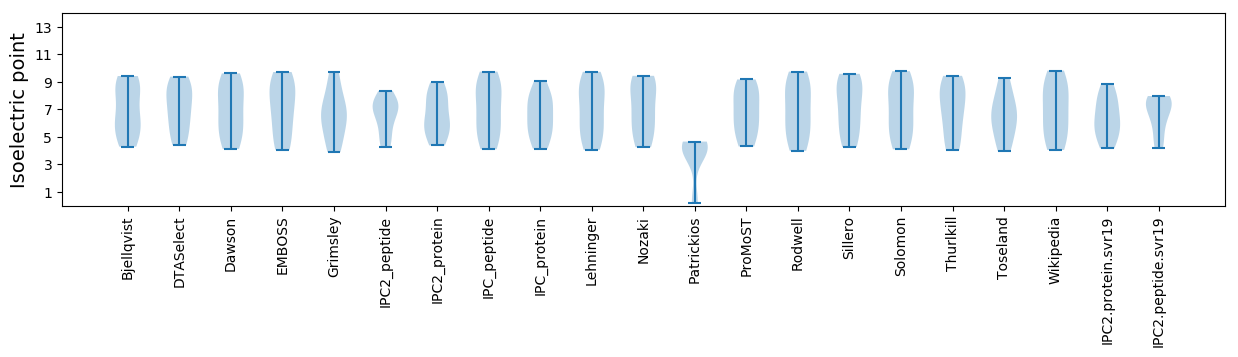
* You can choose from 21 different methods for calculating isoelectric point
Summary statistics related to proteome-wise predictions
Protein with the lowest isoelectric point:
>tr|D3KY93|D3KY93_9CLOS 59-kDa protein OS=Cucurbit chlorotic yellows virus OX=558690 GN=p59 PE=4 SV=1
MM1 pKa = 7.35GLKK4 pKa = 9.82IVLYY8 pKa = 9.58YY9 pKa = 8.59FNCGFSIYY17 pKa = 10.0YY18 pKa = 10.54CSDD21 pKa = 2.72NRR23 pKa = 11.84LFEE26 pKa = 4.99GDD28 pKa = 3.78FEE30 pKa = 4.94TIYY33 pKa = 11.09TEE35 pKa = 4.2DD36 pKa = 3.84FKK38 pKa = 11.81DD39 pKa = 3.6LLEE42 pKa = 4.37VVTNYY47 pKa = 10.35PFVKK51 pKa = 10.43LQWW54 pKa = 3.8
MM1 pKa = 7.35GLKK4 pKa = 9.82IVLYY8 pKa = 9.58YY9 pKa = 8.59FNCGFSIYY17 pKa = 10.0YY18 pKa = 10.54CSDD21 pKa = 2.72NRR23 pKa = 11.84LFEE26 pKa = 4.99GDD28 pKa = 3.78FEE30 pKa = 4.94TIYY33 pKa = 11.09TEE35 pKa = 4.2DD36 pKa = 3.84FKK38 pKa = 11.81DD39 pKa = 3.6LLEE42 pKa = 4.37VVTNYY47 pKa = 10.35PFVKK51 pKa = 10.43LQWW54 pKa = 3.8
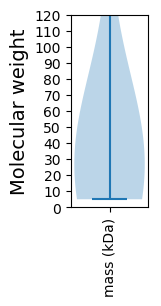
Molecular weight: 6.55 kDa
Isoelectric point according different methods:
Protein with the highest isoelectric point:
>tr|D3KY91|D3KY91_9CLOS Heat shock 70 kDa-like protein OS=Cucurbit chlorotic yellows virus OX=558690 GN=Hsp70h PE=3 SV=1
MM1 pKa = 7.63PKK3 pKa = 10.2AFKK6 pKa = 10.14FDD8 pKa = 3.61RR9 pKa = 11.84YY10 pKa = 10.34LISLQPMSGSASSKK24 pKa = 9.26NQHH27 pKa = 5.36VSNNIYY33 pKa = 10.47FSFCSIYY40 pKa = 10.82LLSS43 pKa = 3.83
MM1 pKa = 7.63PKK3 pKa = 10.2AFKK6 pKa = 10.14FDD8 pKa = 3.61RR9 pKa = 11.84YY10 pKa = 10.34LISLQPMSGSASSKK24 pKa = 9.26NQHH27 pKa = 5.36VSNNIYY33 pKa = 10.47FSFCSIYY40 pKa = 10.82LLSS43 pKa = 3.83
Molecular weight: 4.92 kDa
Isoelectric point according different methods:
Peptides (in silico digests for buttom-up proteomics)
Below you can find in silico digests of the whole proteome with Trypsin, Chymotrypsin, Trypsin+LysC, LysN, ArgC proteases suitable for different mass spec machines.| Try ESI |
 |
|---|
| ChTry ESI |
|
|---|
| ArgC ESI |
|
|---|
| LysN ESI |
|
|---|
| TryLysC ESI |
|
|---|
| Try MALDI |
|
|---|
| ChTry MALDI |
|
|---|
| ArgC MALDI |
|
|---|
| LysN MALDI |
|
|---|
| TryLysC MALDI |
|
|---|
| Try LTQ |
|
|---|
| ChTry LTQ |
|
|---|
| ArgC LTQ |
|
|---|
| LysN LTQ |
|
|---|
| TryLysC LTQ |
|
|---|
| Try MSlow |
|
|---|
| ChTry MSlow |
|
|---|
| ArgC MSlow |
|
|---|
| LysN MSlow |
|
|---|
| TryLysC MSlow |
|
|---|
| Try MShigh |
|
|---|
| ChTry MShigh |
|
|---|
| ArgC MShigh |
|
|---|
| LysN MShigh |
|
|---|
| TryLysC MShigh |
|
|---|
General Statistics
Number of major isoforms |
Number of additional isoforms |
Number of all proteins |
Number of amino acids |
Min. Seq. Length |
Max. Seq. Length |
Avg. Seq. Length |
Avg. Mol. Weight |
|---|---|---|---|---|---|---|---|
0 |
4918 |
43 |
2492 |
447.1 |
51.32 |
Amino acid frequency
Ala |
Cys |
Asp |
Glu |
Phe |
Gly |
His |
Ile |
Lys |
Leu |
|---|---|---|---|---|---|---|---|---|---|
3.945 ± 0.515 | 2.054 ± 0.236 |
6.446 ± 0.377 | 5.388 ± 0.319 |
5.795 ± 0.47 | 4.921 ± 0.483 |
2.013 ± 0.226 | 6.405 ± 0.477 |
7.889 ± 0.353 | 9.333 ± 0.625 |
Met |
Asn |
Gln |
Pro |
Arg |
Ser |
Thr |
Val |
Trp |
Tyr |
|---|---|---|---|---|---|---|---|---|---|
2.847 ± 0.281 | 6.669 ± 0.642 |
3.66 ± 0.438 | 2.44 ± 0.267 |
4.758 ± 0.434 | 7.869 ± 0.551 |
4.88 ± 0.355 | 7.32 ± 0.388 |
0.712 ± 0.108 | 4.656 ± 0.346 |
Most of the basic statistics you can see at this page can be downloaded from this CSV file
See this proteome in:

Proteome-pI is available under Creative Commons Attribution-NoDerivs license, for more details see here
| Reference: Kozlowski LP. Proteome-pI 2.0: Proteome Isoelectric Point Database Update. Nucleic Acids Res. 2021, doi: 10.1093/nar/gkab944 | Contact: Lukasz P. Kozlowski |