Capnocytophaga ochracea (strain ATCC 27872 / DSM 7271 / JCM 12966 / NCTC 12371 / VPI 2845) (Bacteroides ochraceus)
Taxonomy: cellular organisms; Bacteria; FCB group; Bacteroidetes/Chlorobi group; Bacteroidetes; Flavobacteriia; Flavobacteriales; Flavobacteriaceae; Capnocytophaga; Capnocytophaga ochracea
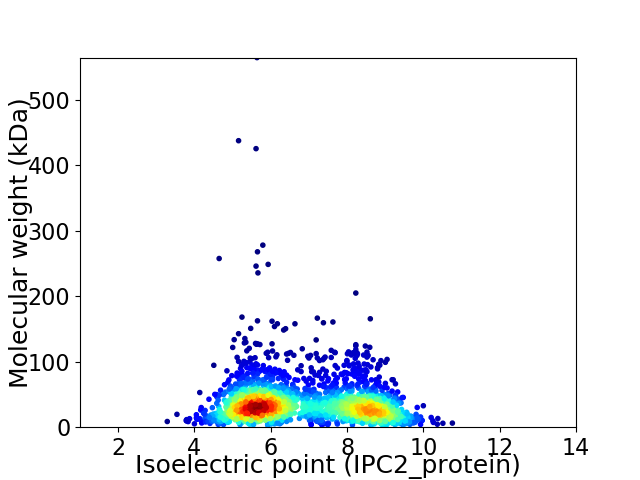
Average proteome isoelectric point is 6.82
Get precalculated fractions of proteins

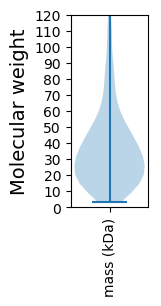
Virtual 2D-PAGE plot for 2171 proteins (isoelectric point calculated using IPC2_protein)
Get csv file with sequences according to given criteria:
* You can choose from 21 different methods for calculating isoelectric point
Summary statistics related to proteome-wise predictions


Protein with the lowest isoelectric point:
>tr|C7M8M1|C7M8M1_CAPOD Peptidyl-prolyl cis-trans isomerase OS=Capnocytophaga ochracea (strain ATCC 27872 / DSM 7271 / JCM 12966 / NCTC 12371 / VPI 2845) OX=521097 GN=Coch_1855 PE=3 SV=1
MM1 pKa = 7.2VYY3 pKa = 10.24KK4 pKa = 10.47FRR6 pKa = 11.84VILDD10 pKa = 3.34VKK12 pKa = 10.59EE13 pKa = 4.43DD14 pKa = 3.55VFRR17 pKa = 11.84DD18 pKa = 3.78IIIQGEE24 pKa = 4.14ATLEE28 pKa = 4.12DD29 pKa = 3.84LHH31 pKa = 8.34NVINQSFGFAGDD43 pKa = 3.71EE44 pKa = 3.98MASFYY49 pKa = 10.78LTDD52 pKa = 3.85EE53 pKa = 4.61DD54 pKa = 4.31WNQGEE59 pKa = 5.09EE60 pKa = 3.72ITLFDD65 pKa = 3.66VSEE68 pKa = 4.36SGEE71 pKa = 3.95MRR73 pKa = 11.84LMEE76 pKa = 4.42EE77 pKa = 4.02TTIEE81 pKa = 4.31SVVSEE86 pKa = 4.69EE87 pKa = 4.2EE88 pKa = 3.86PKK90 pKa = 10.83LLYY93 pKa = 10.78VYY95 pKa = 10.74DD96 pKa = 4.91FMSMWTFFVEE106 pKa = 4.1LVEE109 pKa = 4.55IDD111 pKa = 3.72EE112 pKa = 4.76EE113 pKa = 4.57EE114 pKa = 4.29TGVSYY119 pKa = 9.66PALIYY124 pKa = 10.79AHH126 pKa = 6.73GSIPAEE132 pKa = 4.05APEE135 pKa = 4.23KK136 pKa = 11.14SFVADD141 pKa = 4.29DD142 pKa = 3.58FDD144 pKa = 4.18EE145 pKa = 5.95FEE147 pKa = 6.04DD148 pKa = 4.03EE149 pKa = 5.96FNDD152 pKa = 4.28FDD154 pKa = 6.35LDD156 pKa = 3.79EE157 pKa = 6.22DD158 pKa = 4.84DD159 pKa = 4.65YY160 pKa = 11.96GSFSGEE166 pKa = 3.43EE167 pKa = 4.49YY168 pKa = 10.79YY169 pKa = 11.25
MM1 pKa = 7.2VYY3 pKa = 10.24KK4 pKa = 10.47FRR6 pKa = 11.84VILDD10 pKa = 3.34VKK12 pKa = 10.59EE13 pKa = 4.43DD14 pKa = 3.55VFRR17 pKa = 11.84DD18 pKa = 3.78IIIQGEE24 pKa = 4.14ATLEE28 pKa = 4.12DD29 pKa = 3.84LHH31 pKa = 8.34NVINQSFGFAGDD43 pKa = 3.71EE44 pKa = 3.98MASFYY49 pKa = 10.78LTDD52 pKa = 3.85EE53 pKa = 4.61DD54 pKa = 4.31WNQGEE59 pKa = 5.09EE60 pKa = 3.72ITLFDD65 pKa = 3.66VSEE68 pKa = 4.36SGEE71 pKa = 3.95MRR73 pKa = 11.84LMEE76 pKa = 4.42EE77 pKa = 4.02TTIEE81 pKa = 4.31SVVSEE86 pKa = 4.69EE87 pKa = 4.2EE88 pKa = 3.86PKK90 pKa = 10.83LLYY93 pKa = 10.78VYY95 pKa = 10.74DD96 pKa = 4.91FMSMWTFFVEE106 pKa = 4.1LVEE109 pKa = 4.55IDD111 pKa = 3.72EE112 pKa = 4.76EE113 pKa = 4.57EE114 pKa = 4.29TGVSYY119 pKa = 9.66PALIYY124 pKa = 10.79AHH126 pKa = 6.73GSIPAEE132 pKa = 4.05APEE135 pKa = 4.23KK136 pKa = 11.14SFVADD141 pKa = 4.29DD142 pKa = 3.58FDD144 pKa = 4.18EE145 pKa = 5.95FEE147 pKa = 6.04DD148 pKa = 4.03EE149 pKa = 5.96FNDD152 pKa = 4.28FDD154 pKa = 6.35LDD156 pKa = 3.79EE157 pKa = 6.22DD158 pKa = 4.84DD159 pKa = 4.65YY160 pKa = 11.96GSFSGEE166 pKa = 3.43EE167 pKa = 4.49YY168 pKa = 10.79YY169 pKa = 11.25
Molecular weight: 19.64 kDa
Isoelectric point according different methods:
Protein with the highest isoelectric point:
>tr|C7M5P0|C7M5P0_CAPOD Uncharacterized protein OS=Capnocytophaga ochracea (strain ATCC 27872 / DSM 7271 / JCM 12966 / NCTC 12371 / VPI 2845) OX=521097 GN=Coch_0287 PE=4 SV=1
MM1 pKa = 7.45KK2 pKa = 9.59RR3 pKa = 11.84TFQPSKK9 pKa = 9.13RR10 pKa = 11.84KK11 pKa = 9.48RR12 pKa = 11.84RR13 pKa = 11.84NKK15 pKa = 9.49HH16 pKa = 3.94GFRR19 pKa = 11.84EE20 pKa = 4.19RR21 pKa = 11.84MATANGRR28 pKa = 11.84KK29 pKa = 8.93VLARR33 pKa = 11.84RR34 pKa = 11.84RR35 pKa = 11.84AKK37 pKa = 10.08GRR39 pKa = 11.84KK40 pKa = 8.3KK41 pKa = 9.83LTVSSEE47 pKa = 3.9PRR49 pKa = 11.84HH50 pKa = 5.77KK51 pKa = 10.61KK52 pKa = 9.84
MM1 pKa = 7.45KK2 pKa = 9.59RR3 pKa = 11.84TFQPSKK9 pKa = 9.13RR10 pKa = 11.84KK11 pKa = 9.48RR12 pKa = 11.84RR13 pKa = 11.84NKK15 pKa = 9.49HH16 pKa = 3.94GFRR19 pKa = 11.84EE20 pKa = 4.19RR21 pKa = 11.84MATANGRR28 pKa = 11.84KK29 pKa = 8.93VLARR33 pKa = 11.84RR34 pKa = 11.84RR35 pKa = 11.84AKK37 pKa = 10.08GRR39 pKa = 11.84KK40 pKa = 8.3KK41 pKa = 9.83LTVSSEE47 pKa = 3.9PRR49 pKa = 11.84HH50 pKa = 5.77KK51 pKa = 10.61KK52 pKa = 9.84
Molecular weight: 6.26 kDa
Isoelectric point according different methods:
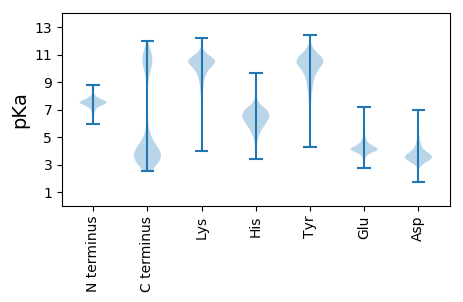
Peptides (in silico digests for buttom-up proteomics)
Below you can find in silico digests of the whole proteome with Trypsin, Chymotrypsin, Trypsin+LysC, LysN, ArgC proteases suitable for different mass spec machines.| Try ESI |
 |
|---|
| ChTry ESI |
 |
|---|
| ArgC ESI |
 |
|---|
| LysN ESI |
 |
|---|
| TryLysC ESI |
 |
|---|
| Try MALDI |
 |
|---|
| ChTry MALDI |
 |
|---|
| ArgC MALDI |
 |
|---|
| LysN MALDI |
 |
|---|
| TryLysC MALDI |
 |
|---|
| Try LTQ |
 |
|---|
| ChTry LTQ |
 |
|---|
| ArgC LTQ |
 |
|---|
| LysN LTQ |
 |
|---|
| TryLysC LTQ |
 |
|---|
| Try MSlow |
 |
|---|
| ChTry MSlow |
 |
|---|
| ArgC MSlow |
 |
|---|
| LysN MSlow |
 |
|---|
| TryLysC MSlow |
 |
|---|
| Try MShigh |
 |
|---|
| ChTry MShigh |
 |
|---|
| ArgC MShigh |
 |
|---|
| LysN MShigh |
 |
|---|
| TryLysC MShigh |
 |
|---|
General Statistics
Number of major isoforms |
Number of additional isoforms |
Number of all proteins |
Number of amino acids |
Min. Seq. Length |
Max. Seq. Length |
Avg. Seq. Length |
Avg. Mol. Weight |
|---|---|---|---|---|---|---|---|
0 |
749313 |
31 |
5298 |
345.1 |
39.0 |
Amino acid frequency
Ala |
Cys |
Asp |
Glu |
Phe |
Gly |
His |
Ile |
Lys |
Leu |
|---|---|---|---|---|---|---|---|---|---|
6.969 ± 0.051 | 0.813 ± 0.023 |
4.999 ± 0.033 | 6.632 ± 0.056 |
4.93 ± 0.049 | 6.367 ± 0.052 |
1.881 ± 0.028 | 7.165 ± 0.043 |
7.611 ± 0.062 | 9.337 ± 0.077 |
Met |
Asn |
Gln |
Pro |
Arg |
Ser |
Thr |
Val |
Trp |
Tyr |
|---|---|---|---|---|---|---|---|---|---|
2.15 ± 0.028 | 5.523 ± 0.048 |
3.702 ± 0.035 | 3.867 ± 0.038 |
3.888 ± 0.032 | 5.804 ± 0.033 |
6.305 ± 0.11 | 6.509 ± 0.047 |
1.086 ± 0.018 | 4.463 ± 0.041 |
Most of the basic statistics you can see at this page can be downloaded from this CSV file
Proteome-pI is available under Creative Commons Attribution-NoDerivs license, for more details see here
| Reference: Kozlowski LP. Proteome-pI 2.0: Proteome Isoelectric Point Database Update. Nucleic Acids Res. 2021, doi: 10.1093/nar/gkab944 | Contact: Lukasz P. Kozlowski |
