Acidithiobacillus sulfuriphilus
Taxonomy: cellular organisms; Bacteria; Proteobacteria; Acidithiobacillia; Acidithiobacillales; Acidithiobacillaceae; Acidithiobacillus
Average proteome isoelectric point is 6.77
Get precalculated fractions of proteins

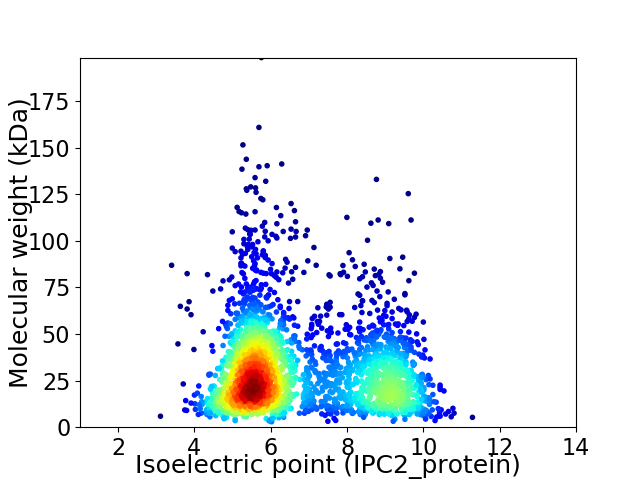
Virtual 2D-PAGE plot for 2736 proteins (isoelectric point calculated using IPC2_protein)
Get csv file with sequences according to given criteria:
* You can choose from 21 different methods for calculating isoelectric point
Summary statistics related to proteome-wise predictions


Protein with the lowest isoelectric point:
>tr|A0A3M8QXW1|A0A3M8QXW1_9PROT Sigma-54-dependent Fis family transcriptional regulator OS=Acidithiobacillus sulfuriphilus OX=1867749 GN=EC580_09125 PE=4 SV=1
MM1 pKa = 7.6SGISGVVNNALTGLLTAQNALQVTGDD27 pKa = 3.65NIANVNTPGYY37 pKa = 8.3SQQSIVQSTISPTFLGGQFLGNGTQVEE64 pKa = 4.89TVQRR68 pKa = 11.84AYY70 pKa = 11.27SSFLQGQVWSATAAASGQASLSSGLQQVLGLLNGSGGVSSQVSQFFSGVAQVAASPADD128 pKa = 3.33IPARR132 pKa = 11.84QAMLANAQTLAQTFQVLGGQLAGIATGVNQQIGQSVSQINTLTQQIAKK180 pKa = 9.96VNTQIASLQGLGNGSPNDD198 pKa = 3.97LLDD201 pKa = 4.53QRR203 pKa = 11.84DD204 pKa = 3.71QLITQLNQQVGVNVLQQSNGQTNVYY229 pKa = 9.84LSNGQVLVAGSQAFQLQAQASPYY252 pKa = 10.04NGQTMDD258 pKa = 3.27VGYY261 pKa = 10.56ASNGSDD267 pKa = 2.37ITANITGGTLGGLIQFRR284 pKa = 11.84NQSLNPAQNALGQMADD300 pKa = 3.52AMAATLNAQQSQGLDD315 pKa = 3.35LNGQAGKK322 pKa = 10.51ALFASGPVQIFASQFNSGTATISGSISNANQLTSSDD358 pKa = 4.36YY359 pKa = 11.29LLQDD363 pKa = 3.59NGGTWTVTNRR373 pKa = 11.84STGQALAYY381 pKa = 9.51TSGSVGNGTFTSGVAGSVTTLAFAGVQVSVSGANSGDD418 pKa = 3.71SFLVEE423 pKa = 4.21PTRR426 pKa = 11.84LGATAMQAVLGNPSGIAAASPYY448 pKa = 10.13VSNAGILSSGAIVSSNLGNLTLSAGQYY475 pKa = 9.2VSSSGSSDD483 pKa = 3.39VLASGAAFLAPLQITLTSGGSGSASVGFQVSSGGTGSSGIIATGTLSLGGSGTNIDD539 pKa = 3.84IPYY542 pKa = 10.24ASNPPGGYY550 pKa = 8.16WQVNLSGTLAASGDD564 pKa = 4.08AFTLTQAGPGNNGNAAAMAALATSGTMSNGTATFNDD600 pKa = 3.54AAAQLVTQVATQAGQAQTNAAGQQAVLQQATAAQQSLSGVNLDD643 pKa = 3.77QEE645 pKa = 4.56AANLIQYY652 pKa = 7.44QQAYY656 pKa = 7.93QAAAKK661 pKa = 9.77AIQVGNSLFQSLIQALL677 pKa = 3.73
MM1 pKa = 7.6SGISGVVNNALTGLLTAQNALQVTGDD27 pKa = 3.65NIANVNTPGYY37 pKa = 8.3SQQSIVQSTISPTFLGGQFLGNGTQVEE64 pKa = 4.89TVQRR68 pKa = 11.84AYY70 pKa = 11.27SSFLQGQVWSATAAASGQASLSSGLQQVLGLLNGSGGVSSQVSQFFSGVAQVAASPADD128 pKa = 3.33IPARR132 pKa = 11.84QAMLANAQTLAQTFQVLGGQLAGIATGVNQQIGQSVSQINTLTQQIAKK180 pKa = 9.96VNTQIASLQGLGNGSPNDD198 pKa = 3.97LLDD201 pKa = 4.53QRR203 pKa = 11.84DD204 pKa = 3.71QLITQLNQQVGVNVLQQSNGQTNVYY229 pKa = 9.84LSNGQVLVAGSQAFQLQAQASPYY252 pKa = 10.04NGQTMDD258 pKa = 3.27VGYY261 pKa = 10.56ASNGSDD267 pKa = 2.37ITANITGGTLGGLIQFRR284 pKa = 11.84NQSLNPAQNALGQMADD300 pKa = 3.52AMAATLNAQQSQGLDD315 pKa = 3.35LNGQAGKK322 pKa = 10.51ALFASGPVQIFASQFNSGTATISGSISNANQLTSSDD358 pKa = 4.36YY359 pKa = 11.29LLQDD363 pKa = 3.59NGGTWTVTNRR373 pKa = 11.84STGQALAYY381 pKa = 9.51TSGSVGNGTFTSGVAGSVTTLAFAGVQVSVSGANSGDD418 pKa = 3.71SFLVEE423 pKa = 4.21PTRR426 pKa = 11.84LGATAMQAVLGNPSGIAAASPYY448 pKa = 10.13VSNAGILSSGAIVSSNLGNLTLSAGQYY475 pKa = 9.2VSSSGSSDD483 pKa = 3.39VLASGAAFLAPLQITLTSGGSGSASVGFQVSSGGTGSSGIIATGTLSLGGSGTNIDD539 pKa = 3.84IPYY542 pKa = 10.24ASNPPGGYY550 pKa = 8.16WQVNLSGTLAASGDD564 pKa = 4.08AFTLTQAGPGNNGNAAAMAALATSGTMSNGTATFNDD600 pKa = 3.54AAAQLVTQVATQAGQAQTNAAGQQAVLQQATAAQQSLSGVNLDD643 pKa = 3.77QEE645 pKa = 4.56AANLIQYY652 pKa = 7.44QQAYY656 pKa = 7.93QAAAKK661 pKa = 9.77AIQVGNSLFQSLIQALL677 pKa = 3.73
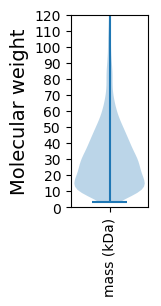
Molecular weight: 67.35 kDa
Isoelectric point according different methods:
Protein with the highest isoelectric point:
>tr|A0A3M8QNA3|A0A3M8QNA3_9PROT GNAT family N-acetyltransferase OS=Acidithiobacillus sulfuriphilus OX=1867749 GN=EC580_14050 PE=4 SV=1
MM1 pKa = 7.45KK2 pKa = 9.53RR3 pKa = 11.84TFQPSIIHH11 pKa = 6.85RR12 pKa = 11.84KK13 pKa = 6.58RR14 pKa = 11.84THH16 pKa = 5.78GFRR19 pKa = 11.84ARR21 pKa = 11.84MATRR25 pKa = 11.84SGRR28 pKa = 11.84LVLKK32 pKa = 10.34RR33 pKa = 11.84RR34 pKa = 11.84RR35 pKa = 11.84AKK37 pKa = 10.17GRR39 pKa = 11.84HH40 pKa = 5.26RR41 pKa = 11.84LSAA44 pKa = 3.8
MM1 pKa = 7.45KK2 pKa = 9.53RR3 pKa = 11.84TFQPSIIHH11 pKa = 6.85RR12 pKa = 11.84KK13 pKa = 6.58RR14 pKa = 11.84THH16 pKa = 5.78GFRR19 pKa = 11.84ARR21 pKa = 11.84MATRR25 pKa = 11.84SGRR28 pKa = 11.84LVLKK32 pKa = 10.34RR33 pKa = 11.84RR34 pKa = 11.84RR35 pKa = 11.84AKK37 pKa = 10.17GRR39 pKa = 11.84HH40 pKa = 5.26RR41 pKa = 11.84LSAA44 pKa = 3.8
Molecular weight: 5.28 kDa
Isoelectric point according different methods:
Peptides (in silico digests for buttom-up proteomics)
Below you can find in silico digests of the whole proteome with Trypsin, Chymotrypsin, Trypsin+LysC, LysN, ArgC proteases suitable for different mass spec machines.| Try ESI |
 |
|---|
| ChTry ESI |
 |
|---|
| ArgC ESI |
 |
|---|
| LysN ESI |
 |
|---|
| TryLysC ESI |
 |
|---|
| Try MALDI |
 |
|---|
| ChTry MALDI |
 |
|---|
| ArgC MALDI |
 |
|---|
| LysN MALDI |
 |
|---|
| TryLysC MALDI |
 |
|---|
| Try LTQ |
 |
|---|
| ChTry LTQ |
 |
|---|
| ArgC LTQ |
 |
|---|
| LysN LTQ |
 |
|---|
| TryLysC LTQ |
 |
|---|
| Try MSlow |
 |
|---|
| ChTry MSlow |
 |
|---|
| ArgC MSlow |
 |
|---|
| LysN MSlow |
 |
|---|
| TryLysC MSlow |
 |
|---|
| Try MShigh |
 |
|---|
| ChTry MShigh |
 |
|---|
| ArgC MShigh |
 |
|---|
| LysN MShigh |
 |
|---|
| TryLysC MShigh |
 |
|---|
General Statistics
Number of major isoforms |
Number of additional isoforms |
Number of all proteins |
Number of amino acids |
Min. Seq. Length |
Max. Seq. Length |
Avg. Seq. Length |
Avg. Mol. Weight |
|---|---|---|---|---|---|---|---|
0 |
820862 |
28 |
1764 |
300.0 |
32.82 |
Amino acid frequency
Ala |
Cys |
Asp |
Glu |
Phe |
Gly |
His |
Ile |
Lys |
Leu |
|---|---|---|---|---|---|---|---|---|---|
12.039 ± 0.065 | 0.932 ± 0.017 |
4.957 ± 0.035 | 5.506 ± 0.048 |
3.536 ± 0.03 | 8.524 ± 0.046 |
2.551 ± 0.023 | 4.955 ± 0.04 |
2.763 ± 0.039 | 11.498 ± 0.068 |
Met |
Asn |
Gln |
Pro |
Arg |
Ser |
Thr |
Val |
Trp |
Tyr |
|---|---|---|---|---|---|---|---|---|---|
2.432 ± 0.026 | 2.623 ± 0.037 |
5.471 ± 0.037 | 4.295 ± 0.035 |
7.188 ± 0.051 | 5.057 ± 0.035 |
4.606 ± 0.03 | 6.942 ± 0.04 |
1.57 ± 0.026 | 2.556 ± 0.03 |
Most of the basic statistics you can see at this page can be downloaded from this CSV file
Proteome-pI is available under Creative Commons Attribution-NoDerivs license, for more details see here
| Reference: Kozlowski LP. Proteome-pI 2.0: Proteome Isoelectric Point Database Update. Nucleic Acids Res. 2021, doi: 10.1093/nar/gkab944 | Contact: Lukasz P. Kozlowski |
