Lachnospiraceae bacterium G11
Taxonomy: cellular organisms; Bacteria; Terrabacteria group; Firmicutes; Clostridia; Eubacteriales; Lachnospiraceae; unclassified Lachnospiraceae
Average proteome isoelectric point is 5.8
Get precalculated fractions of proteins
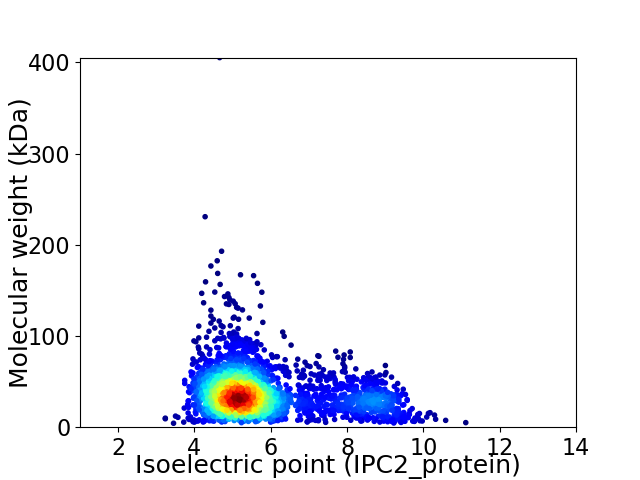
Virtual 2D-PAGE plot for 2732 proteins (isoelectric point calculated using IPC2_protein)
Get csv file with sequences according to given criteria:
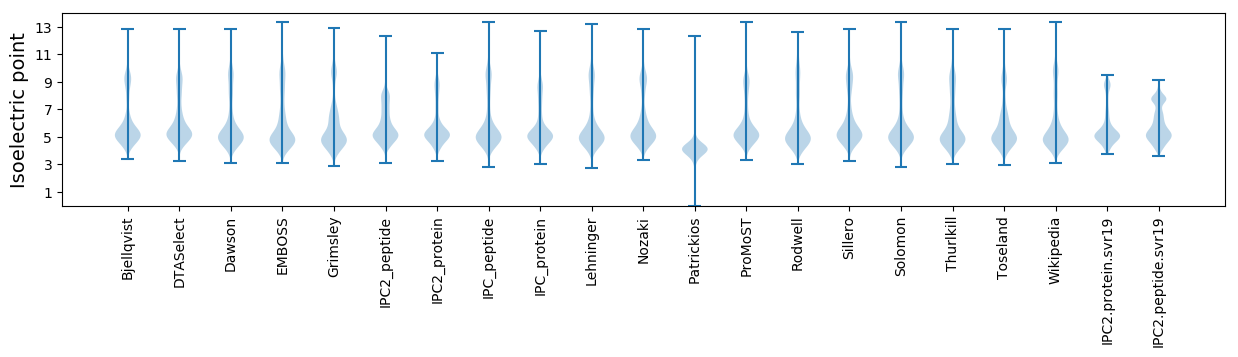
* You can choose from 21 different methods for calculating isoelectric point
Summary statistics related to proteome-wise predictions
Protein with the lowest isoelectric point:
>tr|A0A1G5VTU2|A0A1G5VTU2_9FIRM Predicted dehydrogenase OS=Lachnospiraceae bacterium G11 OX=1200747 GN=SAMN02910368_00830 PE=4 SV=1
MM1 pKa = 6.76VRR3 pKa = 11.84KK4 pKa = 9.61FIKK7 pKa = 9.26KK8 pKa = 6.74TALIIMATMMLTACGAEE25 pKa = 4.07EE26 pKa = 4.15EE27 pKa = 4.57NAGFDD32 pKa = 3.34PGEE35 pKa = 4.37YY36 pKa = 9.44EE37 pKa = 4.83SCWTDD42 pKa = 3.0EE43 pKa = 4.78DD44 pKa = 4.32GDD46 pKa = 4.49LIKK49 pKa = 10.88LIPSEE54 pKa = 3.6NSYY57 pKa = 10.78IFRR60 pKa = 11.84KK61 pKa = 10.02ADD63 pKa = 3.16GRR65 pKa = 11.84VGRR68 pKa = 11.84GTYY71 pKa = 8.06TVNNSQLTYY80 pKa = 11.23DD81 pKa = 3.77RR82 pKa = 11.84FIYY85 pKa = 10.42DD86 pKa = 3.2IVKK89 pKa = 10.9DD90 pKa = 3.98GDD92 pKa = 3.77DD93 pKa = 4.14KK94 pKa = 11.5FYY96 pKa = 11.02LAQNGSTTNTTTEE109 pKa = 3.84ILDD112 pKa = 3.97GYY114 pKa = 11.0VFTKK118 pKa = 9.93IDD120 pKa = 3.28AVEE123 pKa = 3.83IDD125 pKa = 4.72EE126 pKa = 4.73YY127 pKa = 11.02PNDD130 pKa = 3.99LLDD133 pKa = 4.43GVWVSDD139 pKa = 2.84TGTRR143 pKa = 11.84LEE145 pKa = 3.76IDD147 pKa = 3.36MDD149 pKa = 3.2ISEE152 pKa = 4.55YY153 pKa = 10.82SVSHH157 pKa = 6.21EE158 pKa = 4.41NGSGMGTVFDD168 pKa = 4.26YY169 pKa = 11.66GDD171 pKa = 3.48GKK173 pKa = 10.98GVYY176 pKa = 10.29LFATDD181 pKa = 3.83FAYY184 pKa = 10.74VIWIDD189 pKa = 3.22SDD191 pKa = 4.09NITFEE196 pKa = 4.26STDD199 pKa = 3.5PVYY202 pKa = 11.36ADD204 pKa = 3.09ATFTRR209 pKa = 11.84EE210 pKa = 3.38TDD212 pKa = 3.47SYY214 pKa = 11.43GEE216 pKa = 4.43EE217 pKa = 4.31YY218 pKa = 10.92DD219 pKa = 4.99DD220 pKa = 4.61GG221 pKa = 5.68
MM1 pKa = 6.76VRR3 pKa = 11.84KK4 pKa = 9.61FIKK7 pKa = 9.26KK8 pKa = 6.74TALIIMATMMLTACGAEE25 pKa = 4.07EE26 pKa = 4.15EE27 pKa = 4.57NAGFDD32 pKa = 3.34PGEE35 pKa = 4.37YY36 pKa = 9.44EE37 pKa = 4.83SCWTDD42 pKa = 3.0EE43 pKa = 4.78DD44 pKa = 4.32GDD46 pKa = 4.49LIKK49 pKa = 10.88LIPSEE54 pKa = 3.6NSYY57 pKa = 10.78IFRR60 pKa = 11.84KK61 pKa = 10.02ADD63 pKa = 3.16GRR65 pKa = 11.84VGRR68 pKa = 11.84GTYY71 pKa = 8.06TVNNSQLTYY80 pKa = 11.23DD81 pKa = 3.77RR82 pKa = 11.84FIYY85 pKa = 10.42DD86 pKa = 3.2IVKK89 pKa = 10.9DD90 pKa = 3.98GDD92 pKa = 3.77DD93 pKa = 4.14KK94 pKa = 11.5FYY96 pKa = 11.02LAQNGSTTNTTTEE109 pKa = 3.84ILDD112 pKa = 3.97GYY114 pKa = 11.0VFTKK118 pKa = 9.93IDD120 pKa = 3.28AVEE123 pKa = 3.83IDD125 pKa = 4.72EE126 pKa = 4.73YY127 pKa = 11.02PNDD130 pKa = 3.99LLDD133 pKa = 4.43GVWVSDD139 pKa = 2.84TGTRR143 pKa = 11.84LEE145 pKa = 3.76IDD147 pKa = 3.36MDD149 pKa = 3.2ISEE152 pKa = 4.55YY153 pKa = 10.82SVSHH157 pKa = 6.21EE158 pKa = 4.41NGSGMGTVFDD168 pKa = 4.26YY169 pKa = 11.66GDD171 pKa = 3.48GKK173 pKa = 10.98GVYY176 pKa = 10.29LFATDD181 pKa = 3.83FAYY184 pKa = 10.74VIWIDD189 pKa = 3.22SDD191 pKa = 4.09NITFEE196 pKa = 4.26STDD199 pKa = 3.5PVYY202 pKa = 11.36ADD204 pKa = 3.09ATFTRR209 pKa = 11.84EE210 pKa = 3.38TDD212 pKa = 3.47SYY214 pKa = 11.43GEE216 pKa = 4.43EE217 pKa = 4.31YY218 pKa = 10.92DD219 pKa = 4.99DD220 pKa = 4.61GG221 pKa = 5.68
Molecular weight: 24.8 kDa
Isoelectric point according different methods:
Protein with the highest isoelectric point:
>tr|A0A1G5XY58|A0A1G5XY58_9FIRM UPF0365 protein SAMN02910368_02441 OS=Lachnospiraceae bacterium G11 OX=1200747 GN=SAMN02910368_02441 PE=3 SV=1
MM1 pKa = 7.67KK2 pKa = 8.73MTFQPKK8 pKa = 8.63NRR10 pKa = 11.84QRR12 pKa = 11.84SKK14 pKa = 8.89VHH16 pKa = 5.88GFRR19 pKa = 11.84ARR21 pKa = 11.84MSTPGGRR28 pKa = 11.84KK29 pKa = 8.77VLASRR34 pKa = 11.84RR35 pKa = 11.84AKK37 pKa = 9.91GRR39 pKa = 11.84KK40 pKa = 8.69ILSAA44 pKa = 4.02
MM1 pKa = 7.67KK2 pKa = 8.73MTFQPKK8 pKa = 8.63NRR10 pKa = 11.84QRR12 pKa = 11.84SKK14 pKa = 8.89VHH16 pKa = 5.88GFRR19 pKa = 11.84ARR21 pKa = 11.84MSTPGGRR28 pKa = 11.84KK29 pKa = 8.77VLASRR34 pKa = 11.84RR35 pKa = 11.84AKK37 pKa = 9.91GRR39 pKa = 11.84KK40 pKa = 8.69ILSAA44 pKa = 4.02
Molecular weight: 5.03 kDa
Isoelectric point according different methods:
Peptides (in silico digests for buttom-up proteomics)
Below you can find in silico digests of the whole proteome with Trypsin, Chymotrypsin, Trypsin+LysC, LysN, ArgC proteases suitable for different mass spec machines.| Try ESI |
 |
|---|
| ChTry ESI |
|
|---|
| ArgC ESI |
|
|---|
| LysN ESI |
|
|---|
| TryLysC ESI |
|
|---|
| Try MALDI |
|
|---|
| ChTry MALDI |
|
|---|
| ArgC MALDI |
|
|---|
| LysN MALDI |
|
|---|
| TryLysC MALDI |
|
|---|
| Try LTQ |
|
|---|
| ChTry LTQ |
|
|---|
| ArgC LTQ |
|
|---|
| LysN LTQ |
|
|---|
| TryLysC LTQ |
|
|---|
| Try MSlow |
|
|---|
| ChTry MSlow |
|
|---|
| ArgC MSlow |
|
|---|
| LysN MSlow |
|
|---|
| TryLysC MSlow |
|
|---|
| Try MShigh |
|
|---|
| ChTry MShigh |
|
|---|
| ArgC MShigh |
|
|---|
| LysN MShigh |
|
|---|
| TryLysC MShigh |
|
|---|
General Statistics
Number of major isoforms |
Number of additional isoforms |
Number of all proteins |
Number of amino acids |
Min. Seq. Length |
Max. Seq. Length |
Avg. Seq. Length |
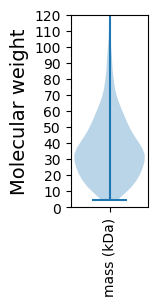
Avg. Mol. Weight |
|---|---|---|---|---|---|---|---|
0 |
939179 |
40 |
3717 |
343.8 |
38.46 |
Amino acid frequency
Ala |
Cys |
Asp |
Glu |
Phe |
Gly |
His |
Ile |
Lys |
Leu |
|---|---|---|---|---|---|---|---|---|---|
7.5 ± 0.046 | 1.361 ± 0.016 |
6.256 ± 0.037 | 7.606 ± 0.048 |
4.407 ± 0.035 | 7.17 ± 0.04 |
1.489 ± 0.017 | 7.679 ± 0.046 |
7.164 ± 0.04 | 8.693 ± 0.046 |
Met |
Asn |
Gln |
Pro |
Arg |
Ser |
Thr |
Val |
Trp |
Tyr |
|---|---|---|---|---|---|---|---|---|---|
2.992 ± 0.02 | 4.676 ± 0.032 |
3.226 ± 0.022 | 2.274 ± 0.021 |
3.953 ± 0.032 | 5.874 ± 0.036 |
5.427 ± 0.03 | 7.069 ± 0.035 |
0.89 ± 0.015 | 4.295 ± 0.034 |
Most of the basic statistics you can see at this page can be downloaded from this CSV file
See this proteome in:

Proteome-pI is available under Creative Commons Attribution-NoDerivs license, for more details see here
| Reference: Kozlowski LP. Proteome-pI 2.0: Proteome Isoelectric Point Database Update. Nucleic Acids Res. 2021, doi: 10.1093/nar/gkab944 | Contact: Lukasz P. Kozlowski |