Streptomyces sp. Mg1
Taxonomy: cellular organisms; Bacteria; Terrabacteria group; Actinobacteria; Actinomycetia; Streptomycetales; Streptomycetaceae; Streptomyces; unclassified Streptomyces
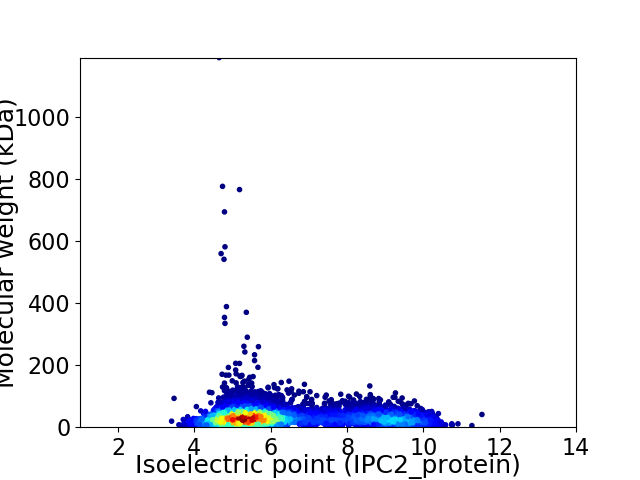
Average proteome isoelectric point is 6.43
Get precalculated fractions of proteins

Virtual 2D-PAGE plot for 7098 proteins (isoelectric point calculated using IPC2_protein)
Get csv file with sequences according to given criteria:
* You can choose from 21 different methods for calculating isoelectric point
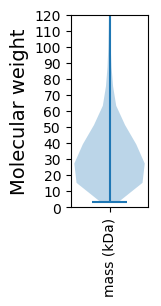
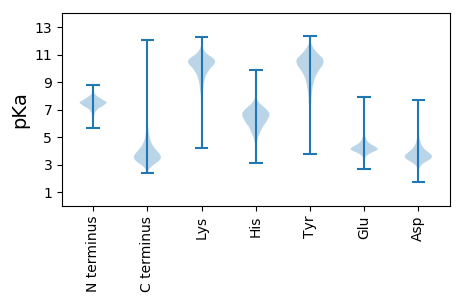
Summary statistics related to proteome-wise predictions


Protein with the lowest isoelectric point:
>tr|B4V634|B4V634_9ACTN Ribulose-phosphate 3-epimerase OS=Streptomyces sp. Mg1 OX=465541 GN=rpe PE=3 SV=1
MM1 pKa = 7.84PPTAPDD7 pKa = 3.61YY8 pKa = 11.12ARR10 pKa = 11.84HH11 pKa = 5.24FTPGHH16 pKa = 4.92TFSYY20 pKa = 10.7EE21 pKa = 3.91DD22 pKa = 4.21GPVGTLSVVDD32 pKa = 4.52AGDD35 pKa = 3.34LRR37 pKa = 11.84LPSGSVVACDD47 pKa = 3.96PFICLGTGDD56 pKa = 4.66IPPFTARR63 pKa = 11.84VAPGSYY69 pKa = 8.81RR70 pKa = 11.84VEE72 pKa = 3.96AAVVTITRR80 pKa = 11.84PEE82 pKa = 3.96EE83 pKa = 3.92PPARR87 pKa = 11.84DD88 pKa = 3.09PHH90 pKa = 7.79LRR92 pKa = 11.84IAAVRR97 pKa = 11.84LVIADD102 pKa = 4.43RR103 pKa = 11.84PAVTWEE109 pKa = 3.92PALHH113 pKa = 6.63EE114 pKa = 4.72GQDD117 pKa = 3.62PATLDD122 pKa = 3.35EE123 pKa = 5.67DD124 pKa = 4.06EE125 pKa = 4.54FFGYY129 pKa = 10.49GVDD132 pKa = 3.55AGTGCFYY139 pKa = 11.14DD140 pKa = 4.11AAADD144 pKa = 4.61DD145 pKa = 4.68SFPDD149 pKa = 3.81CEE151 pKa = 4.43GDD153 pKa = 5.47EE154 pKa = 4.63GPLWDD159 pKa = 4.07AFEE162 pKa = 4.61ATGHH166 pKa = 5.42QPGPYY171 pKa = 9.95LVDD174 pKa = 4.23GEE176 pKa = 4.95DD177 pKa = 3.41GHH179 pKa = 7.63NLVAFGSGWGDD190 pKa = 3.04GAYY193 pKa = 6.63PTWVGRR199 pKa = 11.84DD200 pKa = 3.3AEE202 pKa = 4.45GEE204 pKa = 4.14ITCFVTDD211 pKa = 4.05FFVVPPSEE219 pKa = 4.66DD220 pKa = 3.19LPAA223 pKa = 5.89
MM1 pKa = 7.84PPTAPDD7 pKa = 3.61YY8 pKa = 11.12ARR10 pKa = 11.84HH11 pKa = 5.24FTPGHH16 pKa = 4.92TFSYY20 pKa = 10.7EE21 pKa = 3.91DD22 pKa = 4.21GPVGTLSVVDD32 pKa = 4.52AGDD35 pKa = 3.34LRR37 pKa = 11.84LPSGSVVACDD47 pKa = 3.96PFICLGTGDD56 pKa = 4.66IPPFTARR63 pKa = 11.84VAPGSYY69 pKa = 8.81RR70 pKa = 11.84VEE72 pKa = 3.96AAVVTITRR80 pKa = 11.84PEE82 pKa = 3.96EE83 pKa = 3.92PPARR87 pKa = 11.84DD88 pKa = 3.09PHH90 pKa = 7.79LRR92 pKa = 11.84IAAVRR97 pKa = 11.84LVIADD102 pKa = 4.43RR103 pKa = 11.84PAVTWEE109 pKa = 3.92PALHH113 pKa = 6.63EE114 pKa = 4.72GQDD117 pKa = 3.62PATLDD122 pKa = 3.35EE123 pKa = 5.67DD124 pKa = 4.06EE125 pKa = 4.54FFGYY129 pKa = 10.49GVDD132 pKa = 3.55AGTGCFYY139 pKa = 11.14DD140 pKa = 4.11AAADD144 pKa = 4.61DD145 pKa = 4.68SFPDD149 pKa = 3.81CEE151 pKa = 4.43GDD153 pKa = 5.47EE154 pKa = 4.63GPLWDD159 pKa = 4.07AFEE162 pKa = 4.61ATGHH166 pKa = 5.42QPGPYY171 pKa = 9.95LVDD174 pKa = 4.23GEE176 pKa = 4.95DD177 pKa = 3.41GHH179 pKa = 7.63NLVAFGSGWGDD190 pKa = 3.04GAYY193 pKa = 6.63PTWVGRR199 pKa = 11.84DD200 pKa = 3.3AEE202 pKa = 4.45GEE204 pKa = 4.14ITCFVTDD211 pKa = 4.05FFVVPPSEE219 pKa = 4.66DD220 pKa = 3.19LPAA223 pKa = 5.89
Molecular weight: 23.68 kDa
Isoelectric point according different methods:
Protein with the highest isoelectric point:
>tr|B4VAD2|B4VAD2_9ACTN Magnesium transport protein CorA OS=Streptomyces sp. Mg1 OX=465541 GN=corA PE=3 SV=1
MM1 pKa = 7.69SKK3 pKa = 9.0RR4 pKa = 11.84TFQPNNRR11 pKa = 11.84RR12 pKa = 11.84RR13 pKa = 11.84AKK15 pKa = 8.7THH17 pKa = 5.15GFRR20 pKa = 11.84LRR22 pKa = 11.84MRR24 pKa = 11.84TRR26 pKa = 11.84AGRR29 pKa = 11.84AILANRR35 pKa = 11.84RR36 pKa = 11.84GKK38 pKa = 10.34GRR40 pKa = 11.84AALSAA45 pKa = 3.96
MM1 pKa = 7.69SKK3 pKa = 9.0RR4 pKa = 11.84TFQPNNRR11 pKa = 11.84RR12 pKa = 11.84RR13 pKa = 11.84AKK15 pKa = 8.7THH17 pKa = 5.15GFRR20 pKa = 11.84LRR22 pKa = 11.84MRR24 pKa = 11.84TRR26 pKa = 11.84AGRR29 pKa = 11.84AILANRR35 pKa = 11.84RR36 pKa = 11.84GKK38 pKa = 10.34GRR40 pKa = 11.84AALSAA45 pKa = 3.96
Molecular weight: 5.19 kDa
Isoelectric point according different methods:
Peptides (in silico digests for buttom-up proteomics)
Below you can find in silico digests of the whole proteome with Trypsin, Chymotrypsin, Trypsin+LysC, LysN, ArgC proteases suitable for different mass spec machines.| Try ESI |
 |
|---|
| ChTry ESI |
 |
|---|
| ArgC ESI |
 |
|---|
| LysN ESI |
 |
|---|
| TryLysC ESI |
 |
|---|
| Try MALDI |
 |
|---|
| ChTry MALDI |
 |
|---|
| ArgC MALDI |
 |
|---|
| LysN MALDI |
 |
|---|
| TryLysC MALDI |
 |
|---|
| Try LTQ |
 |
|---|
| ChTry LTQ |
 |
|---|
| ArgC LTQ |
 |
|---|
| LysN LTQ |
 |
|---|
| TryLysC LTQ |
 |
|---|
| Try MSlow |
 |
|---|
| ChTry MSlow |
 |
|---|
| ArgC MSlow |
 |
|---|
| LysN MSlow |
 |
|---|
| TryLysC MSlow |
 |
|---|
| Try MShigh |
 |
|---|
| ChTry MShigh |
 |
|---|
| ArgC MShigh |
 |
|---|
| LysN MShigh |
 |
|---|
| TryLysC MShigh |
 |
|---|
General Statistics
Number of major isoforms |
Number of additional isoforms |
Number of all proteins |
Number of amino acids |
Min. Seq. Length |
Max. Seq. Length |
Avg. Seq. Length |
Avg. Mol. Weight |
|---|---|---|---|---|---|---|---|
0 |
2321781 |
29 |
11478 |
327.1 |
34.89 |
Amino acid frequency
Ala |
Cys |
Asp |
Glu |
Phe |
Gly |
His |
Ile |
Lys |
Leu |
|---|---|---|---|---|---|---|---|---|---|
14.267 ± 0.058 | 0.791 ± 0.008 |
5.718 ± 0.023 | 5.762 ± 0.028 |
2.739 ± 0.014 | 9.65 ± 0.032 |
2.258 ± 0.016 | 3.134 ± 0.021 |
2.135 ± 0.028 | 10.452 ± 0.041 |
Met |
Asn |
Gln |
Pro |
Arg |
Ser |
Thr |
Val |
Trp |
Tyr |
|---|---|---|---|---|---|---|---|---|---|
1.752 ± 0.012 | 1.726 ± 0.018 |
6.182 ± 0.029 | 2.718 ± 0.015 |
7.957 ± 0.036 | 4.993 ± 0.019 |
5.939 ± 0.029 | 8.283 ± 0.029 |
1.508 ± 0.012 | 2.036 ± 0.016 |
Most of the basic statistics you can see at this page can be downloaded from this CSV file
Proteome-pI is available under Creative Commons Attribution-NoDerivs license, for more details see here
| Reference: Kozlowski LP. Proteome-pI 2.0: Proteome Isoelectric Point Database Update. Nucleic Acids Res. 2021, doi: 10.1093/nar/gkab944 | Contact: Lukasz P. Kozlowski |
