Gordonia phage AnClar
Taxonomy: Viruses; Duplodnaviria; Heunggongvirae; Uroviricota; Caudoviricetes; Caudovirales; Siphoviridae; Sourvirus; unclassified Sourvirus
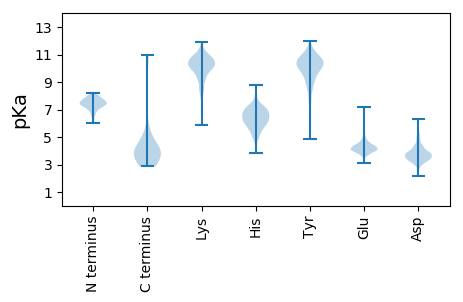
Average proteome isoelectric point is 5.92
Get precalculated fractions of proteins

Virtual 2D-PAGE plot for 81 proteins (isoelectric point calculated using IPC2_protein)
Get csv file with sequences according to given criteria:
* You can choose from 21 different methods for calculating isoelectric point
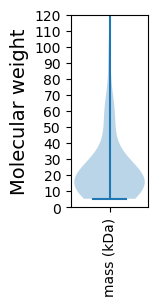
Summary statistics related to proteome-wise predictions


Protein with the lowest isoelectric point:
>tr|A0A6G6XML1|A0A6G6XML1_9CAUD Uncharacterized protein OS=Gordonia phage AnClar OX=2704036 GN=73 PE=4 SV=1
MM1 pKa = 6.61TTPEE5 pKa = 4.48FAPSTNRR12 pKa = 11.84GTALLHH18 pKa = 6.53EE19 pKa = 4.6IMALVEE25 pKa = 4.2AEE27 pKa = 4.41VAAEE31 pKa = 3.79AQAQQRR37 pKa = 11.84VADD40 pKa = 3.93WLANDD45 pKa = 3.6SSARR49 pKa = 11.84HH50 pKa = 5.91WDD52 pKa = 3.32QGDD55 pKa = 3.41WLQANLGAVSDD66 pKa = 4.21SVNLVALATADD77 pKa = 4.34LGLPDD82 pKa = 3.91ATALADD88 pKa = 3.71YY89 pKa = 9.99EE90 pKa = 4.82GEE92 pKa = 4.21FVHH95 pKa = 7.36IDD97 pKa = 3.58LPPTVRR103 pKa = 11.84NLCGTAGCFAGHH115 pKa = 6.61AVMAVGDD122 pKa = 4.24MPHH125 pKa = 7.01LSALVGDD132 pKa = 4.23ILGHH136 pKa = 5.12EE137 pKa = 4.73RR138 pKa = 11.84IDD140 pKa = 3.64VSMHH144 pKa = 5.29QVTTYY149 pKa = 9.63DD150 pKa = 3.07TGDD153 pKa = 3.22TLMVEE158 pKa = 4.86DD159 pKa = 5.2RR160 pKa = 11.84AADD163 pKa = 3.81LLGIDD168 pKa = 4.25TDD170 pKa = 3.96TADD173 pKa = 3.89VLFNASNTLADD184 pKa = 3.5LRR186 pKa = 11.84AIVEE190 pKa = 4.62TIDD193 pKa = 3.17RR194 pKa = 11.84HH195 pKa = 6.08GDD197 pKa = 3.48VVEE200 pKa = 4.27SRR202 pKa = 11.84DD203 pKa = 3.39MCADD207 pKa = 3.36CGEE210 pKa = 4.35WTWRR214 pKa = 11.84CAYY217 pKa = 10.41DD218 pKa = 5.21GEE220 pKa = 4.74TCDD223 pKa = 3.76EE224 pKa = 4.37CDD226 pKa = 3.49EE227 pKa = 5.11HH228 pKa = 7.93EE229 pKa = 4.41VDD231 pKa = 5.07CSCSDD236 pKa = 3.38EE237 pKa = 4.36HH238 pKa = 6.64WCDD241 pKa = 2.88RR242 pKa = 11.84CGNATVDD249 pKa = 5.14DD250 pKa = 4.67EE251 pKa = 6.92GDD253 pKa = 3.36MCEE256 pKa = 4.23DD257 pKa = 5.35CEE259 pKa = 5.46TEE261 pKa = 4.49DD262 pKa = 5.01QDD264 pKa = 5.74SSDD267 pKa = 3.89DD268 pKa = 3.53
MM1 pKa = 6.61TTPEE5 pKa = 4.48FAPSTNRR12 pKa = 11.84GTALLHH18 pKa = 6.53EE19 pKa = 4.6IMALVEE25 pKa = 4.2AEE27 pKa = 4.41VAAEE31 pKa = 3.79AQAQQRR37 pKa = 11.84VADD40 pKa = 3.93WLANDD45 pKa = 3.6SSARR49 pKa = 11.84HH50 pKa = 5.91WDD52 pKa = 3.32QGDD55 pKa = 3.41WLQANLGAVSDD66 pKa = 4.21SVNLVALATADD77 pKa = 4.34LGLPDD82 pKa = 3.91ATALADD88 pKa = 3.71YY89 pKa = 9.99EE90 pKa = 4.82GEE92 pKa = 4.21FVHH95 pKa = 7.36IDD97 pKa = 3.58LPPTVRR103 pKa = 11.84NLCGTAGCFAGHH115 pKa = 6.61AVMAVGDD122 pKa = 4.24MPHH125 pKa = 7.01LSALVGDD132 pKa = 4.23ILGHH136 pKa = 5.12EE137 pKa = 4.73RR138 pKa = 11.84IDD140 pKa = 3.64VSMHH144 pKa = 5.29QVTTYY149 pKa = 9.63DD150 pKa = 3.07TGDD153 pKa = 3.22TLMVEE158 pKa = 4.86DD159 pKa = 5.2RR160 pKa = 11.84AADD163 pKa = 3.81LLGIDD168 pKa = 4.25TDD170 pKa = 3.96TADD173 pKa = 3.89VLFNASNTLADD184 pKa = 3.5LRR186 pKa = 11.84AIVEE190 pKa = 4.62TIDD193 pKa = 3.17RR194 pKa = 11.84HH195 pKa = 6.08GDD197 pKa = 3.48VVEE200 pKa = 4.27SRR202 pKa = 11.84DD203 pKa = 3.39MCADD207 pKa = 3.36CGEE210 pKa = 4.35WTWRR214 pKa = 11.84CAYY217 pKa = 10.41DD218 pKa = 5.21GEE220 pKa = 4.74TCDD223 pKa = 3.76EE224 pKa = 4.37CDD226 pKa = 3.49EE227 pKa = 5.11HH228 pKa = 7.93EE229 pKa = 4.41VDD231 pKa = 5.07CSCSDD236 pKa = 3.38EE237 pKa = 4.36HH238 pKa = 6.64WCDD241 pKa = 2.88RR242 pKa = 11.84CGNATVDD249 pKa = 5.14DD250 pKa = 4.67EE251 pKa = 6.92GDD253 pKa = 3.36MCEE256 pKa = 4.23DD257 pKa = 5.35CEE259 pKa = 5.46TEE261 pKa = 4.49DD262 pKa = 5.01QDD264 pKa = 5.74SSDD267 pKa = 3.89DD268 pKa = 3.53
Molecular weight: 28.96 kDa
Isoelectric point according different methods:
Protein with the highest isoelectric point:
>tr|A0A6G6XM99|A0A6G6XM99_9CAUD Ribbon-helix-helix DNA binding domain protein OS=Gordonia phage AnClar OX=2704036 GN=58 PE=4 SV=1
MM1 pKa = 6.92TTTEE5 pKa = 4.2PVSKK9 pKa = 10.66YY10 pKa = 10.1GAYY13 pKa = 10.05DD14 pKa = 3.17VEE16 pKa = 4.38RR17 pKa = 11.84AQRR20 pKa = 11.84VAEE23 pKa = 4.06LTRR26 pKa = 11.84AGLSARR32 pKa = 11.84EE33 pKa = 3.41IAARR37 pKa = 11.84LRR39 pKa = 11.84VTVRR43 pKa = 11.84TVGRR47 pKa = 11.84DD48 pKa = 3.11RR49 pKa = 11.84RR50 pKa = 11.84RR51 pKa = 11.84TGTNGHH57 pKa = 6.45RR58 pKa = 11.84PARR61 pKa = 11.84WSEE64 pKa = 3.95EE65 pKa = 3.43KK66 pKa = 10.52LARR69 pKa = 11.84AKK71 pKa = 10.85ALLDD75 pKa = 4.19DD76 pKa = 4.37GASYY80 pKa = 11.13RR81 pKa = 11.84EE82 pKa = 3.73TAMTVGCDD90 pKa = 3.29PTHH93 pKa = 6.55LRR95 pKa = 11.84RR96 pKa = 11.84RR97 pKa = 11.84FPGYY101 pKa = 9.94GWPPGHH107 pKa = 6.71WPEE110 pKa = 4.34GLNPQIIAAARR121 pKa = 11.84RR122 pKa = 11.84EE123 pKa = 4.16KK124 pKa = 10.98
MM1 pKa = 6.92TTTEE5 pKa = 4.2PVSKK9 pKa = 10.66YY10 pKa = 10.1GAYY13 pKa = 10.05DD14 pKa = 3.17VEE16 pKa = 4.38RR17 pKa = 11.84AQRR20 pKa = 11.84VAEE23 pKa = 4.06LTRR26 pKa = 11.84AGLSARR32 pKa = 11.84EE33 pKa = 3.41IAARR37 pKa = 11.84LRR39 pKa = 11.84VTVRR43 pKa = 11.84TVGRR47 pKa = 11.84DD48 pKa = 3.11RR49 pKa = 11.84RR50 pKa = 11.84RR51 pKa = 11.84TGTNGHH57 pKa = 6.45RR58 pKa = 11.84PARR61 pKa = 11.84WSEE64 pKa = 3.95EE65 pKa = 3.43KK66 pKa = 10.52LARR69 pKa = 11.84AKK71 pKa = 10.85ALLDD75 pKa = 4.19DD76 pKa = 4.37GASYY80 pKa = 11.13RR81 pKa = 11.84EE82 pKa = 3.73TAMTVGCDD90 pKa = 3.29PTHH93 pKa = 6.55LRR95 pKa = 11.84RR96 pKa = 11.84RR97 pKa = 11.84FPGYY101 pKa = 9.94GWPPGHH107 pKa = 6.71WPEE110 pKa = 4.34GLNPQIIAAARR121 pKa = 11.84RR122 pKa = 11.84EE123 pKa = 4.16KK124 pKa = 10.98
Molecular weight: 13.95 kDa
Isoelectric point according different methods:
Peptides (in silico digests for buttom-up proteomics)
Below you can find in silico digests of the whole proteome with Trypsin, Chymotrypsin, Trypsin+LysC, LysN, ArgC proteases suitable for different mass spec machines.| Try ESI |
 |
|---|
| ChTry ESI |
 |
|---|
| ArgC ESI |
 |
|---|
| LysN ESI |
 |
|---|
| TryLysC ESI |
 |
|---|
| Try MALDI |
 |
|---|
| ChTry MALDI |
 |
|---|
| ArgC MALDI |
 |
|---|
| LysN MALDI |
 |
|---|
| TryLysC MALDI |
 |
|---|
| Try LTQ |
 |
|---|
| ChTry LTQ |
 |
|---|
| ArgC LTQ |
 |
|---|
| LysN LTQ |
 |
|---|
| TryLysC LTQ |
 |
|---|
| Try MSlow |
 |
|---|
| ChTry MSlow |
 |
|---|
| ArgC MSlow |
 |
|---|
| LysN MSlow |
 |
|---|
| TryLysC MSlow |
 |
|---|
| Try MShigh |
 |
|---|
| ChTry MShigh |
 |
|---|
| ArgC MShigh |
 |
|---|
| LysN MShigh |
 |
|---|
| TryLysC MShigh |
 |
|---|
General Statistics
Number of major isoforms |
Number of additional isoforms |
Number of all proteins |
Number of amino acids |
Min. Seq. Length |
Max. Seq. Length |
Avg. Seq. Length |
Avg. Mol. Weight |
|---|---|---|---|---|---|---|---|
0 |
19187 |
49 |
1828 |
236.9 |
25.53 |
Amino acid frequency
Ala |
Cys |
Asp |
Glu |
Phe |
Gly |
His |
Ile |
Lys |
Leu |
|---|---|---|---|---|---|---|---|---|---|
12.519 ± 0.3 | 0.98 ± 0.162 |
6.89 ± 0.295 | 5.816 ± 0.303 |
2.371 ± 0.164 | 8.818 ± 0.423 |
1.876 ± 0.175 | 4.352 ± 0.268 |
2.324 ± 0.178 | 8.151 ± 0.233 |
Met |
Asn |
Gln |
Pro |
Arg |
Ser |
Thr |
Val |
Trp |
Tyr |
|---|---|---|---|---|---|---|---|---|---|
2.434 ± 0.116 | 2.752 ± 0.199 |
5.681 ± 0.268 | 3.502 ± 0.204 |
6.947 ± 0.342 | 5.707 ± 0.212 |
6.864 ± 0.227 | 7.886 ± 0.202 |
2.017 ± 0.095 | 2.111 ± 0.166 |
Most of the basic statistics you can see at this page can be downloaded from this CSV file
Proteome-pI is available under Creative Commons Attribution-NoDerivs license, for more details see here
| Reference: Kozlowski LP. Proteome-pI 2.0: Proteome Isoelectric Point Database Update. Nucleic Acids Res. 2021, doi: 10.1093/nar/gkab944 | Contact: Lukasz P. Kozlowski |
