Corynebacterium sp. HMSC04H06
Taxonomy: cellular organisms; Bacteria; Terrabacteria group; Actinobacteria; Actinomycetia; Corynebacteriales; Corynebacteriaceae; Corynebacterium; unclassified Corynebacterium
Average proteome isoelectric point is 5.88
Get precalculated fractions of proteins

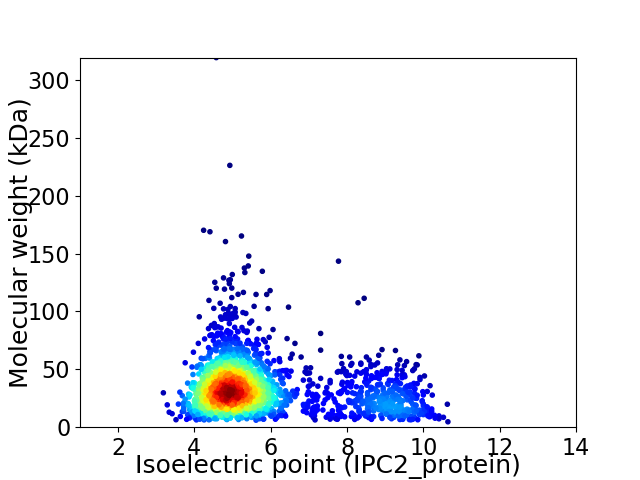
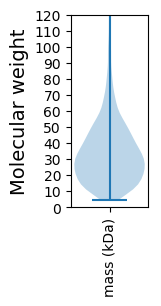
Virtual 2D-PAGE plot for 2014 proteins (isoelectric point calculated using IPC2_protein)
Get csv file with sequences according to given criteria:
* You can choose from 21 different methods for calculating isoelectric point
Summary statistics related to proteome-wise predictions


Protein with the lowest isoelectric point:
>tr|A0A1F1L8G1|A0A1F1L8G1_9CORY Uncharacterized protein OS=Corynebacterium sp. HMSC04H06 OX=1581050 GN=HMPREF3067_00760 PE=4 SV=1
MM1 pKa = 7.2KK2 pKa = 9.99RR3 pKa = 11.84AAIATAALALALTGCSAADD22 pKa = 3.86PEE24 pKa = 4.39PTADD28 pKa = 3.49GTVSQDD34 pKa = 3.19TFLTAHH40 pKa = 6.93GLVDD44 pKa = 3.8MDD46 pKa = 3.54AVEE49 pKa = 5.62IIDD52 pKa = 3.65HH53 pKa = 7.28LDD55 pKa = 3.38RR56 pKa = 11.84QKK58 pKa = 9.9VTEE61 pKa = 4.56RR62 pKa = 11.84PTDD65 pKa = 4.58LIASVRR71 pKa = 11.84ADD73 pKa = 3.78EE74 pKa = 5.15LLLSSDD80 pKa = 3.74DD81 pKa = 3.88QEE83 pKa = 4.73VVLDD87 pKa = 4.2LPDD90 pKa = 3.53NQTYY94 pKa = 10.58VSIAPYY100 pKa = 8.84LTSTHH105 pKa = 6.73DD106 pKa = 3.63CFYY109 pKa = 11.16HH110 pKa = 7.35SLTTCQGEE118 pKa = 4.63LDD120 pKa = 4.0NEE122 pKa = 4.81DD123 pKa = 3.4IQVTITDD130 pKa = 3.75EE131 pKa = 4.08ATGEE135 pKa = 4.27VLVDD139 pKa = 3.43EE140 pKa = 4.91ATTTFDD146 pKa = 3.45NGFIGFWLPDD156 pKa = 3.78DD157 pKa = 3.77ATGLIEE163 pKa = 4.24VSYY166 pKa = 10.53QGRR169 pKa = 11.84TGTAEE174 pKa = 4.15FSTADD179 pKa = 3.86DD180 pKa = 4.25GATCVTDD187 pKa = 3.36LHH189 pKa = 6.16LTT191 pKa = 3.66
MM1 pKa = 7.2KK2 pKa = 9.99RR3 pKa = 11.84AAIATAALALALTGCSAADD22 pKa = 3.86PEE24 pKa = 4.39PTADD28 pKa = 3.49GTVSQDD34 pKa = 3.19TFLTAHH40 pKa = 6.93GLVDD44 pKa = 3.8MDD46 pKa = 3.54AVEE49 pKa = 5.62IIDD52 pKa = 3.65HH53 pKa = 7.28LDD55 pKa = 3.38RR56 pKa = 11.84QKK58 pKa = 9.9VTEE61 pKa = 4.56RR62 pKa = 11.84PTDD65 pKa = 4.58LIASVRR71 pKa = 11.84ADD73 pKa = 3.78EE74 pKa = 5.15LLLSSDD80 pKa = 3.74DD81 pKa = 3.88QEE83 pKa = 4.73VVLDD87 pKa = 4.2LPDD90 pKa = 3.53NQTYY94 pKa = 10.58VSIAPYY100 pKa = 8.84LTSTHH105 pKa = 6.73DD106 pKa = 3.63CFYY109 pKa = 11.16HH110 pKa = 7.35SLTTCQGEE118 pKa = 4.63LDD120 pKa = 4.0NEE122 pKa = 4.81DD123 pKa = 3.4IQVTITDD130 pKa = 3.75EE131 pKa = 4.08ATGEE135 pKa = 4.27VLVDD139 pKa = 3.43EE140 pKa = 4.91ATTTFDD146 pKa = 3.45NGFIGFWLPDD156 pKa = 3.78DD157 pKa = 3.77ATGLIEE163 pKa = 4.24VSYY166 pKa = 10.53QGRR169 pKa = 11.84TGTAEE174 pKa = 4.15FSTADD179 pKa = 3.86DD180 pKa = 4.25GATCVTDD187 pKa = 3.36LHH189 pKa = 6.16LTT191 pKa = 3.66
Molecular weight: 20.46 kDa
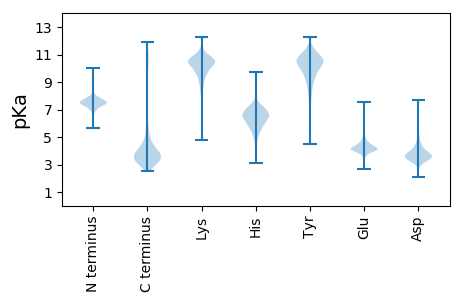
Isoelectric point according different methods:
Protein with the highest isoelectric point:
>tr|A0A1F1L0K4|A0A1F1L0K4_9CORY Cysteine synthase OS=Corynebacterium sp. HMSC04H06 OX=1581050 GN=HMPREF3067_04820 PE=3 SV=1
MM1 pKa = 6.11THH3 pKa = 7.29KK4 pKa = 10.32IKK6 pKa = 10.37PDD8 pKa = 3.02EE9 pKa = 4.07VFAARR14 pKa = 11.84RR15 pKa = 11.84RR16 pKa = 11.84RR17 pKa = 11.84RR18 pKa = 11.84VGIFILLAVLMLIAVVLSIVLGQYY42 pKa = 8.17YY43 pKa = 9.61VPLQDD48 pKa = 5.08LVPILLGSDD57 pKa = 3.2HH58 pKa = 6.85HH59 pKa = 7.23AGLAASVVWDD69 pKa = 3.25IRR71 pKa = 11.84LPRR74 pKa = 11.84ILLGFLVGACLGVAGTLMQAVFANPLAEE102 pKa = 4.0PSIIGVTSGAGVGAALAIVFNIAFLGTFTVPFFAFLSALVAAGLIYY148 pKa = 10.47QLARR152 pKa = 11.84SSGRR156 pKa = 11.84VAVINLVLTGIAVNAVCGAIISFMVYY182 pKa = 10.44LAPTTSRR189 pKa = 11.84EE190 pKa = 4.06EE191 pKa = 3.82IIFWQMGSLNGAQWKK206 pKa = 6.86HH207 pKa = 4.49TWVVLPIAIVGIAVALRR224 pKa = 11.84LGGALDD230 pKa = 3.63VLALGEE236 pKa = 4.14RR237 pKa = 11.84AAGHH241 pKa = 5.56TGINVSRR248 pKa = 11.84LRR250 pKa = 11.84VIAIVASAILTAGAVAFAGLIGFVGLIVPHH280 pKa = 6.68LFRR283 pKa = 11.84TVVGPEE289 pKa = 3.59NHH291 pKa = 6.54LLIPASALGGAVLIGLADD309 pKa = 3.45VAARR313 pKa = 11.84TMIAFADD320 pKa = 4.04LPIGIFTALVGGPTFFILLRR340 pKa = 11.84RR341 pKa = 11.84MMRR344 pKa = 11.84KK345 pKa = 9.6GMHH348 pKa = 5.9AA349 pKa = 3.47
MM1 pKa = 6.11THH3 pKa = 7.29KK4 pKa = 10.32IKK6 pKa = 10.37PDD8 pKa = 3.02EE9 pKa = 4.07VFAARR14 pKa = 11.84RR15 pKa = 11.84RR16 pKa = 11.84RR17 pKa = 11.84RR18 pKa = 11.84VGIFILLAVLMLIAVVLSIVLGQYY42 pKa = 8.17YY43 pKa = 9.61VPLQDD48 pKa = 5.08LVPILLGSDD57 pKa = 3.2HH58 pKa = 6.85HH59 pKa = 7.23AGLAASVVWDD69 pKa = 3.25IRR71 pKa = 11.84LPRR74 pKa = 11.84ILLGFLVGACLGVAGTLMQAVFANPLAEE102 pKa = 4.0PSIIGVTSGAGVGAALAIVFNIAFLGTFTVPFFAFLSALVAAGLIYY148 pKa = 10.47QLARR152 pKa = 11.84SSGRR156 pKa = 11.84VAVINLVLTGIAVNAVCGAIISFMVYY182 pKa = 10.44LAPTTSRR189 pKa = 11.84EE190 pKa = 4.06EE191 pKa = 3.82IIFWQMGSLNGAQWKK206 pKa = 6.86HH207 pKa = 4.49TWVVLPIAIVGIAVALRR224 pKa = 11.84LGGALDD230 pKa = 3.63VLALGEE236 pKa = 4.14RR237 pKa = 11.84AAGHH241 pKa = 5.56TGINVSRR248 pKa = 11.84LRR250 pKa = 11.84VIAIVASAILTAGAVAFAGLIGFVGLIVPHH280 pKa = 6.68LFRR283 pKa = 11.84TVVGPEE289 pKa = 3.59NHH291 pKa = 6.54LLIPASALGGAVLIGLADD309 pKa = 3.45VAARR313 pKa = 11.84TMIAFADD320 pKa = 4.04LPIGIFTALVGGPTFFILLRR340 pKa = 11.84RR341 pKa = 11.84MMRR344 pKa = 11.84KK345 pKa = 9.6GMHH348 pKa = 5.9AA349 pKa = 3.47
Molecular weight: 36.47 kDa
Isoelectric point according different methods:
Peptides (in silico digests for buttom-up proteomics)
Below you can find in silico digests of the whole proteome with Trypsin, Chymotrypsin, Trypsin+LysC, LysN, ArgC proteases suitable for different mass spec machines.| Try ESI |
 |
|---|
| ChTry ESI |
 |
|---|
| ArgC ESI |
 |
|---|
| LysN ESI |
 |
|---|
| TryLysC ESI |
 |
|---|
| Try MALDI |
 |
|---|
| ChTry MALDI |
 |
|---|
| ArgC MALDI |
 |
|---|
| LysN MALDI |
 |
|---|
| TryLysC MALDI |
 |
|---|
| Try LTQ |
 |
|---|
| ChTry LTQ |
 |
|---|
| ArgC LTQ |
 |
|---|
| LysN LTQ |
 |
|---|
| TryLysC LTQ |
 |
|---|
| Try MSlow |
 |
|---|
| ChTry MSlow |
 |
|---|
| ArgC MSlow |
 |
|---|
| LysN MSlow |
 |
|---|
| TryLysC MSlow |
 |
|---|
| Try MShigh |
 |
|---|
| ChTry MShigh |
 |
|---|
| ArgC MShigh |
 |
|---|
| LysN MShigh |
 |
|---|
| TryLysC MShigh |
 |
|---|
General Statistics
Number of major isoforms |
Number of additional isoforms |
Number of all proteins |
Number of amino acids |
Min. Seq. Length |
Max. Seq. Length |
Avg. Seq. Length |
Avg. Mol. Weight |
|---|---|---|---|---|---|---|---|
0 |
663308 |
40 |
3035 |
329.3 |
35.59 |
Amino acid frequency
Ala |
Cys |
Asp |
Glu |
Phe |
Gly |
His |
Ile |
Lys |
Leu |
|---|---|---|---|---|---|---|---|---|---|
12.275 ± 0.077 | 0.707 ± 0.014 |
6.187 ± 0.054 | 6.327 ± 0.059 |
3.365 ± 0.033 | 8.591 ± 0.042 |
2.123 ± 0.025 | 4.677 ± 0.04 |
3.09 ± 0.04 | 9.663 ± 0.064 |
Met |
Asn |
Gln |
Pro |
Arg |
Ser |
Thr |
Val |
Trp |
Tyr |
|---|---|---|---|---|---|---|---|---|---|
2.145 ± 0.022 | 2.81 ± 0.032 |
5.044 ± 0.04 | 3.539 ± 0.03 |
6.191 ± 0.047 | 5.59 ± 0.035 |
5.765 ± 0.038 | 8.216 ± 0.046 |
1.399 ± 0.024 | 2.296 ± 0.028 |
Most of the basic statistics you can see at this page can be downloaded from this CSV file
Proteome-pI is available under Creative Commons Attribution-NoDerivs license, for more details see here
| Reference: Kozlowski LP. Proteome-pI 2.0: Proteome Isoelectric Point Database Update. Nucleic Acids Res. 2021, doi: 10.1093/nar/gkab944 | Contact: Lukasz P. Kozlowski |
