Natronorubrum sulfidifaciens JCM 14089
Taxonomy: cellular organisms; Archaea; Euryarchaeota; Stenosarchaea group; Halobacteria; Natrialbales; Natrialbaceae; Natronorubrum; Natronorubrum sulfidifaciens
Average proteome isoelectric point is 4.79
Get precalculated fractions of proteins

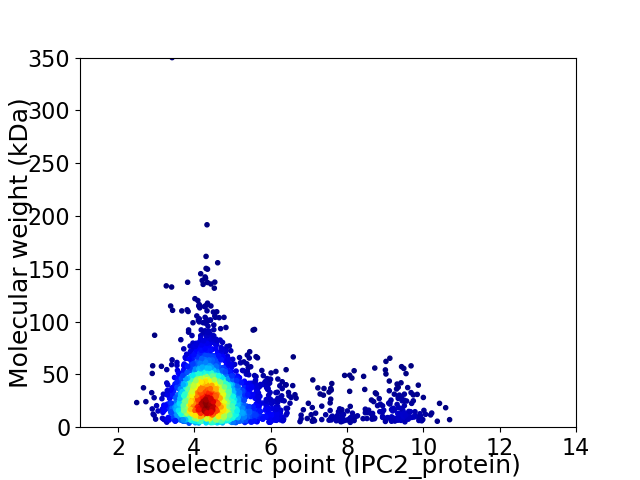
Virtual 2D-PAGE plot for 3428 proteins (isoelectric point calculated using IPC2_protein)
Get csv file with sequences according to given criteria:
* You can choose from 21 different methods for calculating isoelectric point
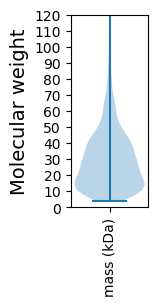
Summary statistics related to proteome-wise predictions


Protein with the lowest isoelectric point:
>tr|L9WD93|L9WD93_9EURY Uncharacterized protein OS=Natronorubrum sulfidifaciens JCM 14089 OX=1230460 GN=C495_03677 PE=4 SV=1
MM1 pKa = 7.44EE2 pKa = 4.86LTWHH6 pKa = 6.23GHH8 pKa = 4.48STWHH12 pKa = 4.69VTVGEE17 pKa = 4.21TALLIDD23 pKa = 4.8PFFDD27 pKa = 3.84NPKK30 pKa = 9.57TDD32 pKa = 5.02LEE34 pKa = 4.4PADD37 pKa = 4.78IDD39 pKa = 3.84TPDD42 pKa = 3.68YY43 pKa = 11.39VLLTHH48 pKa = 6.39GHH50 pKa = 7.03ADD52 pKa = 3.94HH53 pKa = 6.95IADD56 pKa = 4.27AGAFSDD62 pKa = 3.87ATLVATPEE70 pKa = 4.14LVSYY74 pKa = 10.45CQDD77 pKa = 2.84EE78 pKa = 4.78FGFEE82 pKa = 4.11DD83 pKa = 3.7AVGGMGMNLGGTVEE97 pKa = 4.54CGDD100 pKa = 3.9AFVTMVRR107 pKa = 11.84ADD109 pKa = 3.55HH110 pKa = 6.68TNGIMTEE117 pKa = 3.94NDD119 pKa = 3.09ASGGMPAGFVISDD132 pKa = 3.79TKK134 pKa = 8.88PTQVADD140 pKa = 3.87EE141 pKa = 4.58EE142 pKa = 4.71STAFYY147 pKa = 10.94NAGDD151 pKa = 3.83TSLMTEE157 pKa = 3.71MRR159 pKa = 11.84EE160 pKa = 4.05VVGPYY165 pKa = 10.16LEE167 pKa = 5.0PDD169 pKa = 3.25AAAVPIGDD177 pKa = 4.72HH178 pKa = 5.56FTMGPWQAAVAVDD191 pKa = 3.81WLDD194 pKa = 2.8VDD196 pKa = 4.01YY197 pKa = 11.12ALPQHH202 pKa = 6.94YY203 pKa = 7.94DD204 pKa = 3.16TFPPIEE210 pKa = 4.01QDD212 pKa = 3.09PEE214 pKa = 3.91EE215 pKa = 4.42FEE217 pKa = 5.27RR218 pKa = 11.84EE219 pKa = 4.14VKK221 pKa = 9.78ATGSDD226 pKa = 3.22ADD228 pKa = 3.95VVIAEE233 pKa = 4.38ADD235 pKa = 3.63EE236 pKa = 4.7PFDD239 pKa = 3.54II240 pKa = 5.69
MM1 pKa = 7.44EE2 pKa = 4.86LTWHH6 pKa = 6.23GHH8 pKa = 4.48STWHH12 pKa = 4.69VTVGEE17 pKa = 4.21TALLIDD23 pKa = 4.8PFFDD27 pKa = 3.84NPKK30 pKa = 9.57TDD32 pKa = 5.02LEE34 pKa = 4.4PADD37 pKa = 4.78IDD39 pKa = 3.84TPDD42 pKa = 3.68YY43 pKa = 11.39VLLTHH48 pKa = 6.39GHH50 pKa = 7.03ADD52 pKa = 3.94HH53 pKa = 6.95IADD56 pKa = 4.27AGAFSDD62 pKa = 3.87ATLVATPEE70 pKa = 4.14LVSYY74 pKa = 10.45CQDD77 pKa = 2.84EE78 pKa = 4.78FGFEE82 pKa = 4.11DD83 pKa = 3.7AVGGMGMNLGGTVEE97 pKa = 4.54CGDD100 pKa = 3.9AFVTMVRR107 pKa = 11.84ADD109 pKa = 3.55HH110 pKa = 6.68TNGIMTEE117 pKa = 3.94NDD119 pKa = 3.09ASGGMPAGFVISDD132 pKa = 3.79TKK134 pKa = 8.88PTQVADD140 pKa = 3.87EE141 pKa = 4.58EE142 pKa = 4.71STAFYY147 pKa = 10.94NAGDD151 pKa = 3.83TSLMTEE157 pKa = 3.71MRR159 pKa = 11.84EE160 pKa = 4.05VVGPYY165 pKa = 10.16LEE167 pKa = 5.0PDD169 pKa = 3.25AAAVPIGDD177 pKa = 4.72HH178 pKa = 5.56FTMGPWQAAVAVDD191 pKa = 3.81WLDD194 pKa = 2.8VDD196 pKa = 4.01YY197 pKa = 11.12ALPQHH202 pKa = 6.94YY203 pKa = 7.94DD204 pKa = 3.16TFPPIEE210 pKa = 4.01QDD212 pKa = 3.09PEE214 pKa = 3.91EE215 pKa = 4.42FEE217 pKa = 5.27RR218 pKa = 11.84EE219 pKa = 4.14VKK221 pKa = 9.78ATGSDD226 pKa = 3.22ADD228 pKa = 3.95VVIAEE233 pKa = 4.38ADD235 pKa = 3.63EE236 pKa = 4.7PFDD239 pKa = 3.54II240 pKa = 5.69
Molecular weight: 25.9 kDa
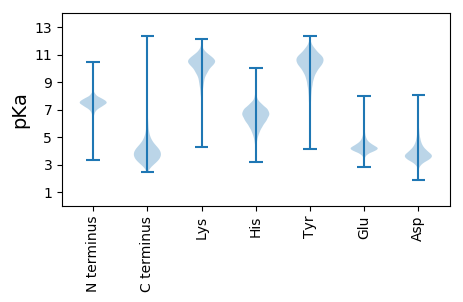
Isoelectric point according different methods:
Protein with the highest isoelectric point:
>tr|L9W1D0|L9W1D0_9EURY Sodium/hydrogen exchanger OS=Natronorubrum sulfidifaciens JCM 14089 OX=1230460 GN=C495_16233 PE=4 SV=1
MM1 pKa = 7.52AKK3 pKa = 10.19KK4 pKa = 10.18SGHH7 pKa = 5.14FSMRR11 pKa = 11.84IVDD14 pKa = 4.49WFSMDD19 pKa = 3.19RR20 pKa = 11.84VFTKK24 pKa = 10.29FIFEE28 pKa = 4.19VLLPSTIILTRR39 pKa = 11.84QCNIYY44 pKa = 10.72NRR46 pKa = 11.84VICNRR51 pKa = 11.84IFLIYY56 pKa = 10.24ILMIHH61 pKa = 6.87RR62 pKa = 11.84DD63 pKa = 3.35VPRR66 pKa = 11.84AKK68 pKa = 10.39RR69 pKa = 11.84LVTVNCRR76 pKa = 11.84QQ77 pKa = 3.08
MM1 pKa = 7.52AKK3 pKa = 10.19KK4 pKa = 10.18SGHH7 pKa = 5.14FSMRR11 pKa = 11.84IVDD14 pKa = 4.49WFSMDD19 pKa = 3.19RR20 pKa = 11.84VFTKK24 pKa = 10.29FIFEE28 pKa = 4.19VLLPSTIILTRR39 pKa = 11.84QCNIYY44 pKa = 10.72NRR46 pKa = 11.84VICNRR51 pKa = 11.84IFLIYY56 pKa = 10.24ILMIHH61 pKa = 6.87RR62 pKa = 11.84DD63 pKa = 3.35VPRR66 pKa = 11.84AKK68 pKa = 10.39RR69 pKa = 11.84LVTVNCRR76 pKa = 11.84QQ77 pKa = 3.08
Molecular weight: 9.28 kDa
Isoelectric point according different methods:
Peptides (in silico digests for buttom-up proteomics)
Below you can find in silico digests of the whole proteome with Trypsin, Chymotrypsin, Trypsin+LysC, LysN, ArgC proteases suitable for different mass spec machines.| Try ESI |
 |
|---|
| ChTry ESI |
 |
|---|
| ArgC ESI |
 |
|---|
| LysN ESI |
 |
|---|
| TryLysC ESI |
 |
|---|
| Try MALDI |
 |
|---|
| ChTry MALDI |
 |
|---|
| ArgC MALDI |
 |
|---|
| LysN MALDI |
 |
|---|
| TryLysC MALDI |
 |
|---|
| Try LTQ |
 |
|---|
| ChTry LTQ |
 |
|---|
| ArgC LTQ |
 |
|---|
| LysN LTQ |
 |
|---|
| TryLysC LTQ |
 |
|---|
| Try MSlow |
 |
|---|
| ChTry MSlow |
 |
|---|
| ArgC MSlow |
 |
|---|
| LysN MSlow |
 |
|---|
| TryLysC MSlow |
 |
|---|
| Try MShigh |
 |
|---|
| ChTry MShigh |
 |
|---|
| ArgC MShigh |
 |
|---|
| LysN MShigh |
 |
|---|
| TryLysC MShigh |
 |
|---|
General Statistics
Number of major isoforms |
Number of additional isoforms |
Number of all proteins |
Number of amino acids |
Min. Seq. Length |
Max. Seq. Length |
Avg. Seq. Length |
Avg. Mol. Weight |
|---|---|---|---|---|---|---|---|
0 |
967963 |
34 |
3351 |
282.4 |
30.8 |
Amino acid frequency
Ala |
Cys |
Asp |
Glu |
Phe |
Gly |
His |
Ile |
Lys |
Leu |
|---|---|---|---|---|---|---|---|---|---|
10.444 ± 0.063 | 0.762 ± 0.012 |
8.567 ± 0.059 | 8.927 ± 0.066 |
3.254 ± 0.029 | 8.056 ± 0.042 |
2.112 ± 0.021 | 4.673 ± 0.03 |
1.85 ± 0.026 | 9.036 ± 0.05 |
Met |
Asn |
Gln |
Pro |
Arg |
Ser |
Thr |
Val |
Trp |
Tyr |
|---|---|---|---|---|---|---|---|---|---|
1.797 ± 0.02 | 2.326 ± 0.023 |
4.561 ± 0.028 | 2.656 ± 0.026 |
6.184 ± 0.043 | 5.539 ± 0.029 |
6.802 ± 0.028 | 8.624 ± 0.041 |
1.105 ± 0.017 | 2.72 ± 0.022 |
Most of the basic statistics you can see at this page can be downloaded from this CSV file
Proteome-pI is available under Creative Commons Attribution-NoDerivs license, for more details see here
| Reference: Kozlowski LP. Proteome-pI 2.0: Proteome Isoelectric Point Database Update. Nucleic Acids Res. 2021, doi: 10.1093/nar/gkab944 | Contact: Lukasz P. Kozlowski |
