Spiroplasma eriocheiris
Taxonomy: cellular organisms; Bacteria; Terrabacteria group; Tenericutes; Mollicutes; Entomoplasmatales; Spiroplasmataceae; Spiroplasma
Average proteome isoelectric point is 6.94
Get precalculated fractions of proteins

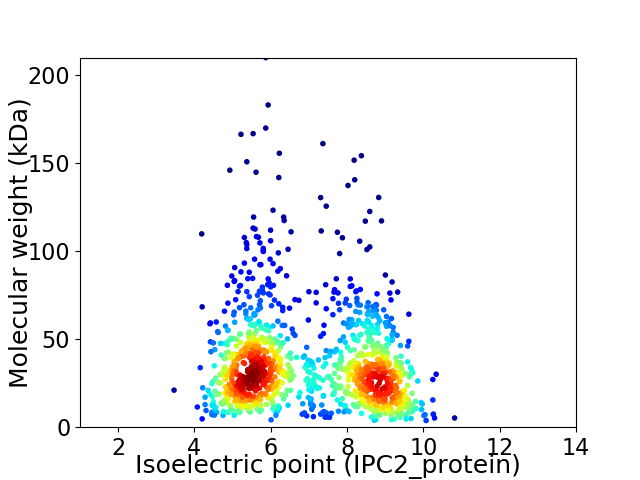
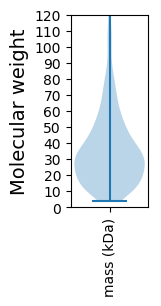
Virtual 2D-PAGE plot for 1180 proteins (isoelectric point calculated using IPC2_protein)
Get csv file with sequences according to given criteria:
* You can choose from 21 different methods for calculating isoelectric point
Summary statistics related to proteome-wise predictions


Protein with the lowest isoelectric point:
>tr|A0A0H3XHB2|A0A0H3XHB2_9MOLU Dihydrofolate reductase OS=Spiroplasma eriocheiris OX=315358 GN=dfrA PE=3 SV=1
MM1 pKa = 7.54KK2 pKa = 10.44NLLTIMSSLTLITTPIISQVGNIQNATPQEE32 pKa = 4.31LLTPGVDD39 pKa = 3.03NNYY42 pKa = 10.47QIDD45 pKa = 4.2ANWDD49 pKa = 3.43FSSAIPSNNEE59 pKa = 3.7TITINAYY66 pKa = 10.13VDD68 pKa = 3.39WSQWDD73 pKa = 3.54PAKK76 pKa = 10.3PQQTLATITTKK87 pKa = 9.87IDD89 pKa = 3.17KK90 pKa = 9.53TLLQDD95 pKa = 5.45DD96 pKa = 4.29NTLGNLMNYY105 pKa = 9.3LNNYY109 pKa = 8.89YY110 pKa = 8.56PTITAGIKK118 pKa = 10.37APFKK122 pKa = 10.55INPEE126 pKa = 3.75VTQYY130 pKa = 11.33GRR132 pKa = 11.84VLEE135 pKa = 6.38GIYY138 pKa = 10.41DD139 pKa = 3.81WNKK142 pKa = 10.33SVQDD146 pKa = 3.97YY147 pKa = 8.35LTGWKK152 pKa = 9.68EE153 pKa = 4.55SYY155 pKa = 9.5WSLNSPTNPFCAEE168 pKa = 3.91QPNNYY173 pKa = 6.86CTRR176 pKa = 11.84GIDD179 pKa = 4.54GLEE182 pKa = 3.95LQQNDD187 pKa = 3.59TFDD190 pKa = 3.91LYY192 pKa = 10.54FVRR195 pKa = 11.84LVV197 pKa = 3.15
MM1 pKa = 7.54KK2 pKa = 10.44NLLTIMSSLTLITTPIISQVGNIQNATPQEE32 pKa = 4.31LLTPGVDD39 pKa = 3.03NNYY42 pKa = 10.47QIDD45 pKa = 4.2ANWDD49 pKa = 3.43FSSAIPSNNEE59 pKa = 3.7TITINAYY66 pKa = 10.13VDD68 pKa = 3.39WSQWDD73 pKa = 3.54PAKK76 pKa = 10.3PQQTLATITTKK87 pKa = 9.87IDD89 pKa = 3.17KK90 pKa = 9.53TLLQDD95 pKa = 5.45DD96 pKa = 4.29NTLGNLMNYY105 pKa = 9.3LNNYY109 pKa = 8.89YY110 pKa = 8.56PTITAGIKK118 pKa = 10.37APFKK122 pKa = 10.55INPEE126 pKa = 3.75VTQYY130 pKa = 11.33GRR132 pKa = 11.84VLEE135 pKa = 6.38GIYY138 pKa = 10.41DD139 pKa = 3.81WNKK142 pKa = 10.33SVQDD146 pKa = 3.97YY147 pKa = 8.35LTGWKK152 pKa = 9.68EE153 pKa = 4.55SYY155 pKa = 9.5WSLNSPTNPFCAEE168 pKa = 3.91QPNNYY173 pKa = 6.86CTRR176 pKa = 11.84GIDD179 pKa = 4.54GLEE182 pKa = 3.95LQQNDD187 pKa = 3.59TFDD190 pKa = 3.91LYY192 pKa = 10.54FVRR195 pKa = 11.84LVV197 pKa = 3.15
Molecular weight: 22.38 kDa
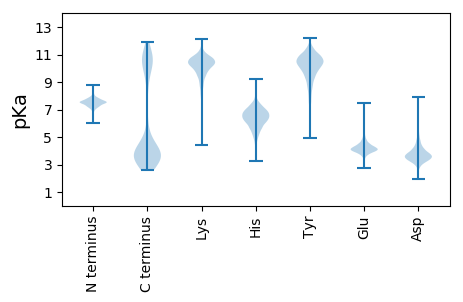
Isoelectric point according different methods:
Protein with the highest isoelectric point:
>tr|A0A0H3XME8|A0A0H3XME8_9MOLU Uncharacterized protein OS=Spiroplasma eriocheiris OX=315358 GN=SERIO_v1c05120 PE=4 SV=1
MM1 pKa = 7.32KK2 pKa = 9.47RR3 pKa = 11.84TWQPSKK9 pKa = 10.14IKK11 pKa = 10.33HH12 pKa = 5.53KK13 pKa = 9.07RR14 pKa = 11.84THH16 pKa = 5.84GFRR19 pKa = 11.84ARR21 pKa = 11.84MQSEE25 pKa = 4.25SGRR28 pKa = 11.84KK29 pKa = 8.22VLSRR33 pKa = 11.84RR34 pKa = 11.84RR35 pKa = 11.84AKK37 pKa = 9.99GRR39 pKa = 11.84KK40 pKa = 8.67VLSAA44 pKa = 4.05
MM1 pKa = 7.32KK2 pKa = 9.47RR3 pKa = 11.84TWQPSKK9 pKa = 10.14IKK11 pKa = 10.33HH12 pKa = 5.53KK13 pKa = 9.07RR14 pKa = 11.84THH16 pKa = 5.84GFRR19 pKa = 11.84ARR21 pKa = 11.84MQSEE25 pKa = 4.25SGRR28 pKa = 11.84KK29 pKa = 8.22VLSRR33 pKa = 11.84RR34 pKa = 11.84RR35 pKa = 11.84AKK37 pKa = 9.99GRR39 pKa = 11.84KK40 pKa = 8.67VLSAA44 pKa = 4.05
Molecular weight: 5.23 kDa
Isoelectric point according different methods:
Peptides (in silico digests for buttom-up proteomics)
Below you can find in silico digests of the whole proteome with Trypsin, Chymotrypsin, Trypsin+LysC, LysN, ArgC proteases suitable for different mass spec machines.| Try ESI |
 |
|---|
| ChTry ESI |
 |
|---|
| ArgC ESI |
 |
|---|
| LysN ESI |
 |
|---|
| TryLysC ESI |
 |
|---|
| Try MALDI |
 |
|---|
| ChTry MALDI |
 |
|---|
| ArgC MALDI |
 |
|---|
| LysN MALDI |
 |
|---|
| TryLysC MALDI |
 |
|---|
| Try LTQ |
 |
|---|
| ChTry LTQ |
 |
|---|
| ArgC LTQ |
 |
|---|
| LysN LTQ |
 |
|---|
| TryLysC LTQ |
 |
|---|
| Try MSlow |
 |
|---|
| ChTry MSlow |
 |
|---|
| ArgC MSlow |
 |
|---|
| LysN MSlow |
 |
|---|
| TryLysC MSlow |
 |
|---|
| Try MShigh |
 |
|---|
| ChTry MShigh |
 |
|---|
| ArgC MShigh |
 |
|---|
| LysN MShigh |
 |
|---|
| TryLysC MShigh |
 |
|---|
General Statistics
Number of major isoforms |
Number of additional isoforms |
Number of all proteins |
Number of amino acids |
Min. Seq. Length |
Max. Seq. Length |
Avg. Seq. Length |
Avg. Mol. Weight |
|---|---|---|---|---|---|---|---|
0 |
390732 |
33 |
1766 |
331.1 |
37.75 |
Amino acid frequency
Ala |
Cys |
Asp |
Glu |
Phe |
Gly |
His |
Ile |
Lys |
Leu |
|---|---|---|---|---|---|---|---|---|---|
5.794 ± 0.062 | 0.745 ± 0.02 |
5.215 ± 0.055 | 5.67 ± 0.098 |
5.037 ± 0.062 | 5.111 ± 0.067 |
1.826 ± 0.029 | 9.605 ± 0.072 |
8.329 ± 0.078 | 10.175 ± 0.08 |
Met |
Asn |
Gln |
Pro |
Arg |
Ser |
Thr |
Val |
Trp |
Tyr |
|---|---|---|---|---|---|---|---|---|---|
2.12 ± 0.029 | 7.461 ± 0.076 |
3.21 ± 0.042 | 4.04 ± 0.042 |
2.819 ± 0.044 | 5.668 ± 0.042 |
5.777 ± 0.054 | 5.903 ± 0.052 |
1.159 ± 0.031 | 4.338 ± 0.044 |
Most of the basic statistics you can see at this page can be downloaded from this CSV file
Proteome-pI is available under Creative Commons Attribution-NoDerivs license, for more details see here
| Reference: Kozlowski LP. Proteome-pI 2.0: Proteome Isoelectric Point Database Update. Nucleic Acids Res. 2021, doi: 10.1093/nar/gkab944 | Contact: Lukasz P. Kozlowski |
