Pararhizobium antarcticum
Taxonomy: cellular organisms; Bacteria; Proteobacteria; Alphaproteobacteria; Hyphomicrobiales; Rhizobiaceae; Rhizobium/Agrobacterium group; Pararhizobium
Average proteome isoelectric point is 6.4
Get precalculated fractions of proteins

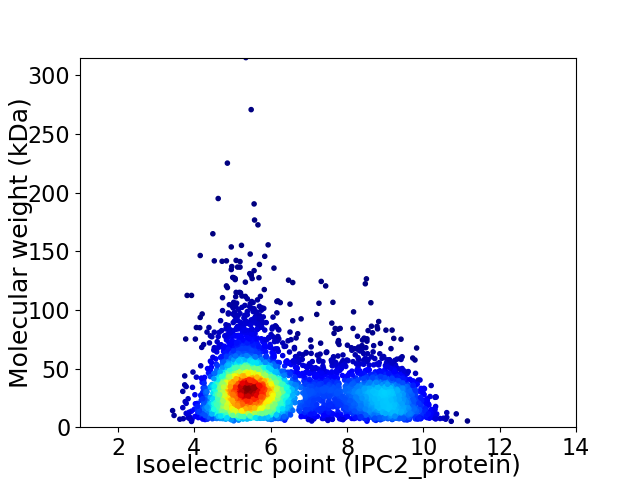
Virtual 2D-PAGE plot for 4832 proteins (isoelectric point calculated using IPC2_protein)
Get csv file with sequences according to given criteria:
* You can choose from 21 different methods for calculating isoelectric point
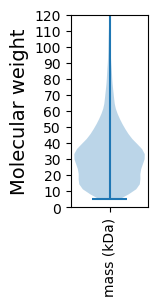
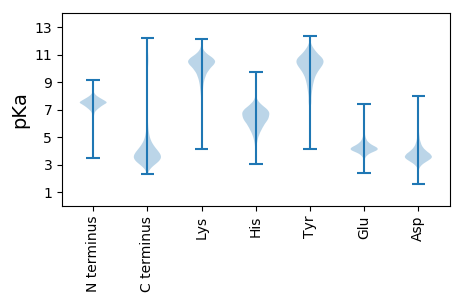
Summary statistics related to proteome-wise predictions


Protein with the lowest isoelectric point:
>tr|A0A657LPZ9|A0A657LPZ9_9RHIZ Chaperone protein DnaK OS=Pararhizobium antarcticum OX=1798805 GN=dnaK PE=2 SV=1
MM1 pKa = 7.49NIKK4 pKa = 10.39SLLLGSAAALAAVSGANAADD24 pKa = 4.6AIVAAEE30 pKa = 4.47PEE32 pKa = 3.93PMEE35 pKa = 4.1YY36 pKa = 10.8VRR38 pKa = 11.84VCDD41 pKa = 4.42AFGTGYY47 pKa = 10.47FYY49 pKa = 10.57IPGTEE54 pKa = 3.83TCLKK58 pKa = 9.4IGGYY62 pKa = 9.79VRR64 pKa = 11.84TQINYY69 pKa = 10.57DD70 pKa = 3.18EE71 pKa = 5.15DD72 pKa = 3.97LTVNGADD79 pKa = 2.89WDD81 pKa = 3.88ARR83 pKa = 11.84TRR85 pKa = 11.84GYY87 pKa = 9.51LTFAAKK93 pKa = 10.46NDD95 pKa = 3.91TEE97 pKa = 4.23YY98 pKa = 9.71GTLSGYY104 pKa = 10.48INLQADD110 pKa = 3.85DD111 pKa = 4.34TNDD114 pKa = 3.46TFLDD118 pKa = 4.36GAWINIAGFDD128 pKa = 3.48VGYY131 pKa = 10.12FYY133 pKa = 11.44NWWDD137 pKa = 3.63DD138 pKa = 3.39MGLSGEE144 pKa = 4.35TDD146 pKa = 3.13VSAGNLSNAIRR157 pKa = 11.84YY158 pKa = 6.62TYY160 pKa = 10.82DD161 pKa = 3.01GGTFKK166 pKa = 11.14VGVAAEE172 pKa = 3.99EE173 pKa = 4.06LAGNGTNDD181 pKa = 3.62DD182 pKa = 4.08VGVSGYY188 pKa = 10.15VAGSIGGVTADD199 pKa = 4.66LVASYY204 pKa = 11.12DD205 pKa = 3.56FDD207 pKa = 4.03VEE209 pKa = 4.12QFAVKK214 pKa = 10.11GRR216 pKa = 11.84LVAEE220 pKa = 4.87IGPGALGILGVYY232 pKa = 10.44ADD234 pKa = 4.18GANFFWDD241 pKa = 3.48VSEE244 pKa = 4.04WSVAAEE250 pKa = 4.01YY251 pKa = 10.28KK252 pKa = 10.33IQATEE257 pKa = 3.96KK258 pKa = 10.8FFITPAAQYY267 pKa = 10.06FGDD270 pKa = 3.81FAFVDD275 pKa = 5.16GNDD278 pKa = 3.03AWKK281 pKa = 10.71VGVTAGYY288 pKa = 10.33QITEE292 pKa = 4.19GLRR295 pKa = 11.84TLATVNYY302 pKa = 10.13LDD304 pKa = 3.91VDD306 pKa = 3.92NVADD310 pKa = 4.24GEE312 pKa = 4.47WTGFVRR318 pKa = 11.84LQRR321 pKa = 11.84DD322 pKa = 3.62FF323 pKa = 4.22
MM1 pKa = 7.49NIKK4 pKa = 10.39SLLLGSAAALAAVSGANAADD24 pKa = 4.6AIVAAEE30 pKa = 4.47PEE32 pKa = 3.93PMEE35 pKa = 4.1YY36 pKa = 10.8VRR38 pKa = 11.84VCDD41 pKa = 4.42AFGTGYY47 pKa = 10.47FYY49 pKa = 10.57IPGTEE54 pKa = 3.83TCLKK58 pKa = 9.4IGGYY62 pKa = 9.79VRR64 pKa = 11.84TQINYY69 pKa = 10.57DD70 pKa = 3.18EE71 pKa = 5.15DD72 pKa = 3.97LTVNGADD79 pKa = 2.89WDD81 pKa = 3.88ARR83 pKa = 11.84TRR85 pKa = 11.84GYY87 pKa = 9.51LTFAAKK93 pKa = 10.46NDD95 pKa = 3.91TEE97 pKa = 4.23YY98 pKa = 9.71GTLSGYY104 pKa = 10.48INLQADD110 pKa = 3.85DD111 pKa = 4.34TNDD114 pKa = 3.46TFLDD118 pKa = 4.36GAWINIAGFDD128 pKa = 3.48VGYY131 pKa = 10.12FYY133 pKa = 11.44NWWDD137 pKa = 3.63DD138 pKa = 3.39MGLSGEE144 pKa = 4.35TDD146 pKa = 3.13VSAGNLSNAIRR157 pKa = 11.84YY158 pKa = 6.62TYY160 pKa = 10.82DD161 pKa = 3.01GGTFKK166 pKa = 11.14VGVAAEE172 pKa = 3.99EE173 pKa = 4.06LAGNGTNDD181 pKa = 3.62DD182 pKa = 4.08VGVSGYY188 pKa = 10.15VAGSIGGVTADD199 pKa = 4.66LVASYY204 pKa = 11.12DD205 pKa = 3.56FDD207 pKa = 4.03VEE209 pKa = 4.12QFAVKK214 pKa = 10.11GRR216 pKa = 11.84LVAEE220 pKa = 4.87IGPGALGILGVYY232 pKa = 10.44ADD234 pKa = 4.18GANFFWDD241 pKa = 3.48VSEE244 pKa = 4.04WSVAAEE250 pKa = 4.01YY251 pKa = 10.28KK252 pKa = 10.33IQATEE257 pKa = 3.96KK258 pKa = 10.8FFITPAAQYY267 pKa = 10.06FGDD270 pKa = 3.81FAFVDD275 pKa = 5.16GNDD278 pKa = 3.03AWKK281 pKa = 10.71VGVTAGYY288 pKa = 10.33QITEE292 pKa = 4.19GLRR295 pKa = 11.84TLATVNYY302 pKa = 10.13LDD304 pKa = 3.91VDD306 pKa = 3.92NVADD310 pKa = 4.24GEE312 pKa = 4.47WTGFVRR318 pKa = 11.84LQRR321 pKa = 11.84DD322 pKa = 3.62FF323 pKa = 4.22
Molecular weight: 34.62 kDa
Isoelectric point according different methods:
Protein with the highest isoelectric point:
>tr|A0A657LKY1|A0A657LKY1_9RHIZ Conjugal transfer protein TrbE OS=Pararhizobium antarcticum OX=1798805 GN=AX760_24775 PE=3 SV=1
MM1 pKa = 7.62TKK3 pKa = 9.11RR4 pKa = 11.84TYY6 pKa = 10.36QPSKK10 pKa = 9.73LVRR13 pKa = 11.84KK14 pKa = 8.95RR15 pKa = 11.84RR16 pKa = 11.84HH17 pKa = 4.81GFRR20 pKa = 11.84SRR22 pKa = 11.84IATKK26 pKa = 10.34GGRR29 pKa = 11.84KK30 pKa = 9.47VITARR35 pKa = 11.84RR36 pKa = 11.84ARR38 pKa = 11.84GRR40 pKa = 11.84KK41 pKa = 9.03RR42 pKa = 11.84LSAA45 pKa = 4.03
MM1 pKa = 7.62TKK3 pKa = 9.11RR4 pKa = 11.84TYY6 pKa = 10.36QPSKK10 pKa = 9.73LVRR13 pKa = 11.84KK14 pKa = 8.95RR15 pKa = 11.84RR16 pKa = 11.84HH17 pKa = 4.81GFRR20 pKa = 11.84SRR22 pKa = 11.84IATKK26 pKa = 10.34GGRR29 pKa = 11.84KK30 pKa = 9.47VITARR35 pKa = 11.84RR36 pKa = 11.84ARR38 pKa = 11.84GRR40 pKa = 11.84KK41 pKa = 9.03RR42 pKa = 11.84LSAA45 pKa = 4.03
Molecular weight: 5.29 kDa
Isoelectric point according different methods:
Peptides (in silico digests for buttom-up proteomics)
Below you can find in silico digests of the whole proteome with Trypsin, Chymotrypsin, Trypsin+LysC, LysN, ArgC proteases suitable for different mass spec machines.| Try ESI |
 |
|---|
| ChTry ESI |
 |
|---|
| ArgC ESI |
 |
|---|
| LysN ESI |
 |
|---|
| TryLysC ESI |
 |
|---|
| Try MALDI |
 |
|---|
| ChTry MALDI |
 |
|---|
| ArgC MALDI |
 |
|---|
| LysN MALDI |
 |
|---|
| TryLysC MALDI |
 |
|---|
| Try LTQ |
 |
|---|
| ChTry LTQ |
 |
|---|
| ArgC LTQ |
 |
|---|
| LysN LTQ |
 |
|---|
| TryLysC LTQ |
 |
|---|
| Try MSlow |
 |
|---|
| ChTry MSlow |
 |
|---|
| ArgC MSlow |
 |
|---|
| LysN MSlow |
 |
|---|
| TryLysC MSlow |
 |
|---|
| Try MShigh |
 |
|---|
| ChTry MShigh |
 |
|---|
| ArgC MShigh |
 |
|---|
| LysN MShigh |
 |
|---|
| TryLysC MShigh |
 |
|---|
General Statistics
Number of major isoforms |
Number of additional isoforms |
Number of all proteins |
Number of amino acids |
Min. Seq. Length |
Max. Seq. Length |
Avg. Seq. Length |
Avg. Mol. Weight |
|---|---|---|---|---|---|---|---|
0 |
1519063 |
41 |
2833 |
314.4 |
34.17 |
Amino acid frequency
Ala |
Cys |
Asp |
Glu |
Phe |
Gly |
His |
Ile |
Lys |
Leu |
|---|---|---|---|---|---|---|---|---|---|
11.902 ± 0.047 | 0.834 ± 0.009 |
5.885 ± 0.028 | 5.5 ± 0.029 |
3.947 ± 0.025 | 8.352 ± 0.033 |
2.027 ± 0.016 | 5.808 ± 0.028 |
3.652 ± 0.029 | 9.959 ± 0.039 |
Met |
Asn |
Gln |
Pro |
Arg |
Ser |
Thr |
Val |
Trp |
Tyr |
|---|---|---|---|---|---|---|---|---|---|
2.693 ± 0.016 | 2.804 ± 0.019 |
4.775 ± 0.025 | 3.14 ± 0.02 |
6.526 ± 0.033 | 5.794 ± 0.028 |
5.593 ± 0.022 | 7.279 ± 0.027 |
1.269 ± 0.013 | 2.261 ± 0.018 |
Most of the basic statistics you can see at this page can be downloaded from this CSV file
Proteome-pI is available under Creative Commons Attribution-NoDerivs license, for more details see here
| Reference: Kozlowski LP. Proteome-pI 2.0: Proteome Isoelectric Point Database Update. Nucleic Acids Res. 2021, doi: 10.1093/nar/gkab944 | Contact: Lukasz P. Kozlowski |
