Pycnoporus cinnabarinus (Cinnabar-red polypore) (Trametes cinnabarina)
Taxonomy: cellular organisms; Eukaryota; Opisthokonta; Fungi; Dikarya; Basidiomycota; Agaricomycotina; Agaricomycetes; Agaricomycetes incertae sedis; Polyporales; Polyporaceae; Trametes
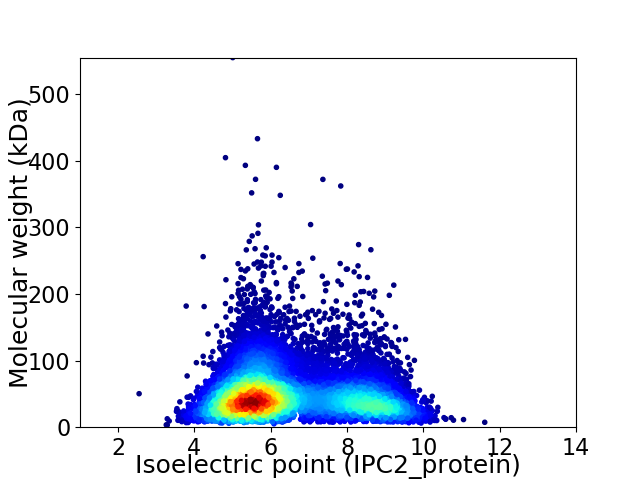
Average proteome isoelectric point is 6.49
Get precalculated fractions of proteins

Virtual 2D-PAGE plot for 10180 proteins (isoelectric point calculated using IPC2_protein)
Get csv file with sequences according to given criteria:
* You can choose from 21 different methods for calculating isoelectric point
Summary statistics related to proteome-wise predictions


Protein with the lowest isoelectric point:
>tr|A0A060SKN8|A0A060SKN8_PYCCI Uncharacterized protein OS=Pycnoporus cinnabarinus OX=5643 GN=BN946_scf185010.g7 PE=4 SV=1
MM1 pKa = 7.65RR2 pKa = 11.84PASFFALLAMCITVQALPIAFTLADD27 pKa = 3.7VSAGTLTSEE36 pKa = 4.59GLFSTALSPVATSSPVAPTDD56 pKa = 3.5SVSDD60 pKa = 3.96VNSTAAIPTASTTDD74 pKa = 3.38TSSDD78 pKa = 3.49PASTDD83 pKa = 3.18NANGASQTDD92 pKa = 3.73PSIASATDD100 pKa = 3.73DD101 pKa = 3.98GSSDD105 pKa = 3.24ASSTVVTDD113 pKa = 4.15SSASPSSTATGDD125 pKa = 3.29RR126 pKa = 11.84ATGTDD131 pKa = 3.55SPTSSAAQPTSTSVSFDD148 pKa = 3.26IPVVPPACLALASGAQTTSLPTSTIASTAFTTLPPSGSSSLSNNTIISTIASNATATPSVTGSSAVSALPTDD220 pKa = 3.85VASNGTLSRR229 pKa = 11.84RR230 pKa = 11.84IAQDD234 pKa = 3.32DD235 pKa = 4.22LPAVAQAWQDD245 pKa = 3.35LCLVSGGDD253 pKa = 2.91IFTNEE258 pKa = 4.2PCVQLAGVNGINALLAHH275 pKa = 7.57ADD277 pKa = 3.45PCAQQDD283 pKa = 3.75NADD286 pKa = 3.63AMIDD290 pKa = 3.8FAKK293 pKa = 10.81SPGVTNSAALIANAVAYY310 pKa = 8.63RR311 pKa = 11.84QHH313 pKa = 6.58PRR315 pKa = 11.84NVLDD319 pKa = 3.4ISGVLPSTPFCQRR332 pKa = 11.84APRR335 pKa = 11.84NAEE338 pKa = 3.53LAGVVNGQLDD348 pKa = 3.89GLNAGIFGSVGVGLFAFGADD368 pKa = 4.08GSCPFGQVPDD378 pKa = 4.57DD379 pKa = 4.0TTCTCSS385 pKa = 2.97
MM1 pKa = 7.65RR2 pKa = 11.84PASFFALLAMCITVQALPIAFTLADD27 pKa = 3.7VSAGTLTSEE36 pKa = 4.59GLFSTALSPVATSSPVAPTDD56 pKa = 3.5SVSDD60 pKa = 3.96VNSTAAIPTASTTDD74 pKa = 3.38TSSDD78 pKa = 3.49PASTDD83 pKa = 3.18NANGASQTDD92 pKa = 3.73PSIASATDD100 pKa = 3.73DD101 pKa = 3.98GSSDD105 pKa = 3.24ASSTVVTDD113 pKa = 4.15SSASPSSTATGDD125 pKa = 3.29RR126 pKa = 11.84ATGTDD131 pKa = 3.55SPTSSAAQPTSTSVSFDD148 pKa = 3.26IPVVPPACLALASGAQTTSLPTSTIASTAFTTLPPSGSSSLSNNTIISTIASNATATPSVTGSSAVSALPTDD220 pKa = 3.85VASNGTLSRR229 pKa = 11.84RR230 pKa = 11.84IAQDD234 pKa = 3.32DD235 pKa = 4.22LPAVAQAWQDD245 pKa = 3.35LCLVSGGDD253 pKa = 2.91IFTNEE258 pKa = 4.2PCVQLAGVNGINALLAHH275 pKa = 7.57ADD277 pKa = 3.45PCAQQDD283 pKa = 3.75NADD286 pKa = 3.63AMIDD290 pKa = 3.8FAKK293 pKa = 10.81SPGVTNSAALIANAVAYY310 pKa = 8.63RR311 pKa = 11.84QHH313 pKa = 6.58PRR315 pKa = 11.84NVLDD319 pKa = 3.4ISGVLPSTPFCQRR332 pKa = 11.84APRR335 pKa = 11.84NAEE338 pKa = 3.53LAGVVNGQLDD348 pKa = 3.89GLNAGIFGSVGVGLFAFGADD368 pKa = 4.08GSCPFGQVPDD378 pKa = 4.57DD379 pKa = 4.0TTCTCSS385 pKa = 2.97
Molecular weight: 38.05 kDa
Isoelectric point according different methods:
Protein with the highest isoelectric point:
>tr|A0A060SJX4|A0A060SJX4_PYCCI Macro domain-containing protein OS=Pycnoporus cinnabarinus OX=5643 GN=BN946_scf184979.g41 PE=4 SV=1
LL1 pKa = 6.5SQQMNPLMRR10 pKa = 11.84APRR13 pKa = 11.84SQLAARR19 pKa = 11.84RR20 pKa = 11.84FHH22 pKa = 5.19QHH24 pKa = 6.2HH25 pKa = 7.69LIQTHH30 pKa = 6.26LRR32 pKa = 11.84PTPSPLPPHH41 pKa = 5.26ATEE44 pKa = 4.59RR45 pKa = 11.84LLAGKK50 pKa = 9.87GGRR53 pKa = 11.84LHH55 pKa = 7.13RR56 pKa = 11.84PLSPKK61 pKa = 8.57IWKK64 pKa = 8.37WLPPRR69 pKa = 11.84PMLRR73 pKa = 11.84RR74 pKa = 11.84LRR76 pKa = 11.84HH77 pKa = 4.01QTRR80 pKa = 11.84GAPALHH86 pKa = 6.4VVAAWALARR95 pKa = 11.84QTGSRR100 pKa = 3.76
LL1 pKa = 6.5SQQMNPLMRR10 pKa = 11.84APRR13 pKa = 11.84SQLAARR19 pKa = 11.84RR20 pKa = 11.84FHH22 pKa = 5.19QHH24 pKa = 6.2HH25 pKa = 7.69LIQTHH30 pKa = 6.26LRR32 pKa = 11.84PTPSPLPPHH41 pKa = 5.26ATEE44 pKa = 4.59RR45 pKa = 11.84LLAGKK50 pKa = 9.87GGRR53 pKa = 11.84LHH55 pKa = 7.13RR56 pKa = 11.84PLSPKK61 pKa = 8.57IWKK64 pKa = 8.37WLPPRR69 pKa = 11.84PMLRR73 pKa = 11.84RR74 pKa = 11.84LRR76 pKa = 11.84HH77 pKa = 4.01QTRR80 pKa = 11.84GAPALHH86 pKa = 6.4VVAAWALARR95 pKa = 11.84QTGSRR100 pKa = 3.76
Molecular weight: 11.47 kDa
Isoelectric point according different methods:
Peptides (in silico digests for buttom-up proteomics)
Below you can find in silico digests of the whole proteome with Trypsin, Chymotrypsin, Trypsin+LysC, LysN, ArgC proteases suitable for different mass spec machines.| Try ESI |
 |
|---|
| ChTry ESI |
 |
|---|
| ArgC ESI |
 |
|---|
| LysN ESI |
 |
|---|
| TryLysC ESI |
 |
|---|
| Try MALDI |
 |
|---|
| ChTry MALDI |
 |
|---|
| ArgC MALDI |
 |
|---|
| LysN MALDI |
 |
|---|
| TryLysC MALDI |
 |
|---|
| Try LTQ |
 |
|---|
| ChTry LTQ |
 |
|---|
| ArgC LTQ |
 |
|---|
| LysN LTQ |
 |
|---|
| TryLysC LTQ |
 |
|---|
| Try MSlow |
 |
|---|
| ChTry MSlow |
 |
|---|
| ArgC MSlow |
 |
|---|
| LysN MSlow |
 |
|---|
| TryLysC MSlow |
 |
|---|
| Try MShigh |
 |
|---|
| ChTry MShigh |
 |
|---|
| ArgC MShigh |
 |
|---|
| LysN MShigh |
 |
|---|
| TryLysC MShigh |
 |
|---|
General Statistics
Number of major isoforms |
Number of additional isoforms |
Number of all proteins |
Number of amino acids |
Min. Seq. Length |
Max. Seq. Length |
Avg. Seq. Length |
Avg. Mol. Weight |
|---|---|---|---|---|---|---|---|
0 |
4930602 |
28 |
5011 |
484.3 |
53.33 |
Amino acid frequency
Ala |
Cys |
Asp |
Glu |
Phe |
Gly |
His |
Ile |
Lys |
Leu |
|---|---|---|---|---|---|---|---|---|---|
9.526 ± 0.025 | 1.126 ± 0.009 |
5.72 ± 0.016 | 6.085 ± 0.026 |
3.534 ± 0.014 | 6.398 ± 0.02 |
2.623 ± 0.011 | 4.41 ± 0.019 |
4.333 ± 0.02 | 9.117 ± 0.024 |
Met |
Asn |
Gln |
Pro |
Arg |
Ser |
Thr |
Val |
Trp |
Tyr |
|---|---|---|---|---|---|---|---|---|---|
1.982 ± 0.008 | 3.077 ± 0.012 |
6.986 ± 0.03 | 3.748 ± 0.016 |
6.589 ± 0.023 | 8.349 ± 0.033 |
5.816 ± 0.016 | 6.413 ± 0.017 |
1.397 ± 0.009 | 2.633 ± 0.012 |
Most of the basic statistics you can see at this page can be downloaded from this CSV file
Proteome-pI is available under Creative Commons Attribution-NoDerivs license, for more details see here
| Reference: Kozlowski LP. Proteome-pI 2.0: Proteome Isoelectric Point Database Update. Nucleic Acids Res. 2021, doi: 10.1093/nar/gkab944 | Contact: Lukasz P. Kozlowski |
