Tomato bushy stunt virus (strain Cherry) (TBSV)
Taxonomy: Viruses; Riboviria; Orthornavirae; Kitrinoviricota; Tolucaviricetes; Tolivirales; Tombusviridae; Procedovirinae; Tombusvirus; Tomato bushy stunt virus
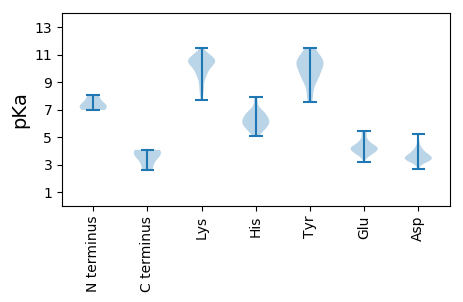
Average proteome isoelectric point is 7.91
Get precalculated fractions of proteins

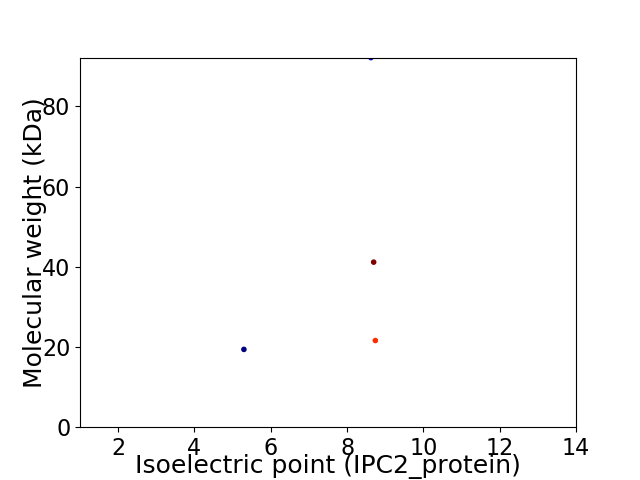
Virtual 2D-PAGE plot for 4 proteins (isoelectric point calculated using IPC2_protein)
Get csv file with sequences according to given criteria:
* You can choose from 21 different methods for calculating isoelectric point
Summary statistics related to proteome-wise predictions


Protein with the lowest isoelectric point:
>sp|P11691|MVP_TBSVC Movement protein OS=Tomato bushy stunt virus (strain Cherry) OX=12147 PE=1 SV=1
MM1 pKa = 7.28EE2 pKa = 5.41RR3 pKa = 11.84AIQGNDD9 pKa = 2.68ARR11 pKa = 11.84EE12 pKa = 3.99QANSEE17 pKa = 4.02RR18 pKa = 11.84WDD20 pKa = 3.81GGSGGTTSPFKK31 pKa = 11.1LPDD34 pKa = 3.7EE35 pKa = 4.69SPSWTEE41 pKa = 3.35WRR43 pKa = 11.84LHH45 pKa = 5.57NDD47 pKa = 3.33EE48 pKa = 4.85TNSNQDD54 pKa = 2.84NPLGFKK60 pKa = 10.19EE61 pKa = 3.92SWGFGKK67 pKa = 10.5VVFKK71 pKa = 10.8RR72 pKa = 11.84YY73 pKa = 9.61LRR75 pKa = 11.84YY76 pKa = 10.37DD77 pKa = 3.21RR78 pKa = 11.84TEE80 pKa = 3.87ASLHH84 pKa = 5.75RR85 pKa = 11.84VLGSWTGDD93 pKa = 3.38SVNYY97 pKa = 9.27AASRR101 pKa = 11.84FFGFDD106 pKa = 3.33QIGCTYY112 pKa = 10.29SIRR115 pKa = 11.84FRR117 pKa = 11.84GVSITVSGGSRR128 pKa = 11.84TLQHH132 pKa = 6.31LCEE135 pKa = 3.73MAIRR139 pKa = 11.84SKK141 pKa = 11.13QEE143 pKa = 3.85LLQLAPIEE151 pKa = 4.34VEE153 pKa = 4.45SNVSRR158 pKa = 11.84GCPEE162 pKa = 3.6GTEE165 pKa = 4.22TFEE168 pKa = 5.11KK169 pKa = 10.56EE170 pKa = 4.08SEE172 pKa = 4.07
MM1 pKa = 7.28EE2 pKa = 5.41RR3 pKa = 11.84AIQGNDD9 pKa = 2.68ARR11 pKa = 11.84EE12 pKa = 3.99QANSEE17 pKa = 4.02RR18 pKa = 11.84WDD20 pKa = 3.81GGSGGTTSPFKK31 pKa = 11.1LPDD34 pKa = 3.7EE35 pKa = 4.69SPSWTEE41 pKa = 3.35WRR43 pKa = 11.84LHH45 pKa = 5.57NDD47 pKa = 3.33EE48 pKa = 4.85TNSNQDD54 pKa = 2.84NPLGFKK60 pKa = 10.19EE61 pKa = 3.92SWGFGKK67 pKa = 10.5VVFKK71 pKa = 10.8RR72 pKa = 11.84YY73 pKa = 9.61LRR75 pKa = 11.84YY76 pKa = 10.37DD77 pKa = 3.21RR78 pKa = 11.84TEE80 pKa = 3.87ASLHH84 pKa = 5.75RR85 pKa = 11.84VLGSWTGDD93 pKa = 3.38SVNYY97 pKa = 9.27AASRR101 pKa = 11.84FFGFDD106 pKa = 3.33QIGCTYY112 pKa = 10.29SIRR115 pKa = 11.84FRR117 pKa = 11.84GVSITVSGGSRR128 pKa = 11.84TLQHH132 pKa = 6.31LCEE135 pKa = 3.73MAIRR139 pKa = 11.84SKK141 pKa = 11.13QEE143 pKa = 3.85LLQLAPIEE151 pKa = 4.34VEE153 pKa = 4.45SNVSRR158 pKa = 11.84GCPEE162 pKa = 3.6GTEE165 pKa = 4.22TFEE168 pKa = 5.11KK169 pKa = 10.56EE170 pKa = 4.08SEE172 pKa = 4.07
Molecular weight: 19.4 kDa
Isoelectric point according different methods:
Protein with the highest isoelectric point:
>sp|P15962|RDRP_TBSVC RNA-directed RNA polymerase OS=Tomato bushy stunt virus (strain Cherry) OX=12147 GN=ORF1 PE=3 SV=2
MM1 pKa = 7.26DD2 pKa = 3.77TEE4 pKa = 4.47YY5 pKa = 11.2EE6 pKa = 4.24QVNKK10 pKa = 9.64PWNEE14 pKa = 3.86LYY16 pKa = 10.75KK17 pKa = 10.36EE18 pKa = 4.31TTLGNKK24 pKa = 8.22LTVNVGMEE32 pKa = 4.07DD33 pKa = 3.42QEE35 pKa = 4.95VPLLPSNFLTKK46 pKa = 10.35VRR48 pKa = 11.84VGLSGGYY55 pKa = 7.7ITMRR59 pKa = 11.84RR60 pKa = 11.84IRR62 pKa = 11.84IKK64 pKa = 10.3IIPLVSRR71 pKa = 11.84KK72 pKa = 10.22AGVSGKK78 pKa = 10.6LYY80 pKa = 10.76LRR82 pKa = 11.84DD83 pKa = 3.52ISDD86 pKa = 3.28TTGRR90 pKa = 11.84KK91 pKa = 8.28LHH93 pKa = 6.02CTEE96 pKa = 4.24SLDD99 pKa = 3.5LGRR102 pKa = 11.84EE103 pKa = 3.65IRR105 pKa = 11.84LTMQHH110 pKa = 6.81LDD112 pKa = 3.56FSVSTRR118 pKa = 11.84SDD120 pKa = 3.36VPIVFGFEE128 pKa = 3.92EE129 pKa = 4.62LVSPFLEE136 pKa = 4.29GRR138 pKa = 11.84EE139 pKa = 4.0LFSISVRR146 pKa = 11.84WQFGLSKK153 pKa = 10.58NCYY156 pKa = 9.96SLPQSKK162 pKa = 9.04WKK164 pKa = 10.7VMYY167 pKa = 10.56QEE169 pKa = 5.23DD170 pKa = 4.07ALKK173 pKa = 10.67VLRR176 pKa = 11.84PSKK179 pKa = 10.54KK180 pKa = 9.65KK181 pKa = 10.59ASKK184 pKa = 9.5TDD186 pKa = 3.22SSVV189 pKa = 2.62
MM1 pKa = 7.26DD2 pKa = 3.77TEE4 pKa = 4.47YY5 pKa = 11.2EE6 pKa = 4.24QVNKK10 pKa = 9.64PWNEE14 pKa = 3.86LYY16 pKa = 10.75KK17 pKa = 10.36EE18 pKa = 4.31TTLGNKK24 pKa = 8.22LTVNVGMEE32 pKa = 4.07DD33 pKa = 3.42QEE35 pKa = 4.95VPLLPSNFLTKK46 pKa = 10.35VRR48 pKa = 11.84VGLSGGYY55 pKa = 7.7ITMRR59 pKa = 11.84RR60 pKa = 11.84IRR62 pKa = 11.84IKK64 pKa = 10.3IIPLVSRR71 pKa = 11.84KK72 pKa = 10.22AGVSGKK78 pKa = 10.6LYY80 pKa = 10.76LRR82 pKa = 11.84DD83 pKa = 3.52ISDD86 pKa = 3.28TTGRR90 pKa = 11.84KK91 pKa = 8.28LHH93 pKa = 6.02CTEE96 pKa = 4.24SLDD99 pKa = 3.5LGRR102 pKa = 11.84EE103 pKa = 3.65IRR105 pKa = 11.84LTMQHH110 pKa = 6.81LDD112 pKa = 3.56FSVSTRR118 pKa = 11.84SDD120 pKa = 3.36VPIVFGFEE128 pKa = 3.92EE129 pKa = 4.62LVSPFLEE136 pKa = 4.29GRR138 pKa = 11.84EE139 pKa = 4.0LFSISVRR146 pKa = 11.84WQFGLSKK153 pKa = 10.58NCYY156 pKa = 9.96SLPQSKK162 pKa = 9.04WKK164 pKa = 10.7VMYY167 pKa = 10.56QEE169 pKa = 5.23DD170 pKa = 4.07ALKK173 pKa = 10.67VLRR176 pKa = 11.84PSKK179 pKa = 10.54KK180 pKa = 9.65KK181 pKa = 10.59ASKK184 pKa = 9.5TDD186 pKa = 3.22SSVV189 pKa = 2.62
Molecular weight: 21.61 kDa
Isoelectric point according different methods:
Peptides (in silico digests for buttom-up proteomics)
Below you can find in silico digests of the whole proteome with Trypsin, Chymotrypsin, Trypsin+LysC, LysN, ArgC proteases suitable for different mass spec machines.| Try ESI |
 |
|---|
| ChTry ESI |
 |
|---|
| ArgC ESI |
 |
|---|
| LysN ESI |
 |
|---|
| TryLysC ESI |
 |
|---|
| Try MALDI |
 |
|---|
| ChTry MALDI |
 |
|---|
| ArgC MALDI |
 |
|---|
| LysN MALDI |
 |
|---|
| TryLysC MALDI |
 |
|---|
| Try LTQ |
 |
|---|
| ChTry LTQ |
 |
|---|
| ArgC LTQ |
 |
|---|
| LysN LTQ |
 |
|---|
| TryLysC LTQ |
 |
|---|
| Try MSlow |
 |
|---|
| ChTry MSlow |
 |
|---|
| ArgC MSlow |
 |
|---|
| LysN MSlow |
 |
|---|
| TryLysC MSlow |
 |
|---|
| Try MShigh |
 |
|---|
| ChTry MShigh |
 |
|---|
| ArgC MShigh |
 |
|---|
| LysN MShigh |
 |
|---|
| TryLysC MShigh |
 |
|---|
General Statistics
Number of major isoforms |
Number of additional isoforms |
Number of all proteins |
Number of amino acids |
Min. Seq. Length |
Max. Seq. Length |
Avg. Seq. Length |
Avg. Mol. Weight |
|---|---|---|---|---|---|---|---|
0 |
1567 |
172 |
818 |
391.8 |
43.57 |
Amino acid frequency
Ala |
Cys |
Asp |
Glu |
Phe |
Gly |
His |
Ile |
Lys |
Leu |
|---|---|---|---|---|---|---|---|---|---|
6.892 ± 1.117 | 1.914 ± 0.337 |
4.595 ± 0.152 | 5.68 ± 1.102 |
3.957 ± 0.212 | 8.041 ± 0.685 |
1.851 ± 0.3 | 4.467 ± 0.152 |
5.424 ± 0.814 | 9.19 ± 0.545 |
Met |
Asn |
Gln |
Pro |
Arg |
Ser |
Thr |
Val |
Trp |
Tyr |
|---|---|---|---|---|---|---|---|---|---|
2.234 ± 0.215 | 4.084 ± 0.66 |
4.34 ± 0.377 | 3.063 ± 0.207 |
7.403 ± 0.855 | 6.892 ± 1.243 |
6.701 ± 1.581 | 8.743 ± 0.685 |
1.34 ± 0.298 | 3.127 ± 0.219 |
Most of the basic statistics you can see at this page can be downloaded from this CSV file
Proteome-pI is available under Creative Commons Attribution-NoDerivs license, for more details see here
| Reference: Kozlowski LP. Proteome-pI 2.0: Proteome Isoelectric Point Database Update. Nucleic Acids Res. 2021, doi: 10.1093/nar/gkab944 | Contact: Lukasz P. Kozlowski |
