Marinobacter sp. X15-166B
Taxonomy: cellular organisms; Bacteria; Proteobacteria; Gammaproteobacteria; Alteromonadales; Alteromonadaceae; Marinobacter; unclassified Marinobacter
Average proteome isoelectric point is 6.24
Get precalculated fractions of proteins

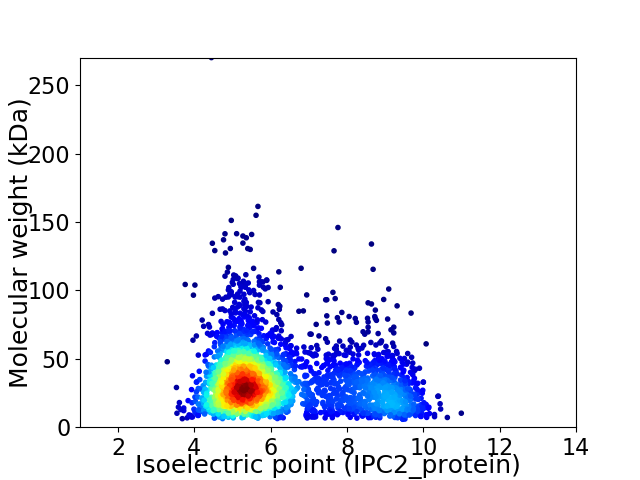
Virtual 2D-PAGE plot for 3115 proteins (isoelectric point calculated using IPC2_protein)
Get csv file with sequences according to given criteria:
* You can choose from 21 different methods for calculating isoelectric point
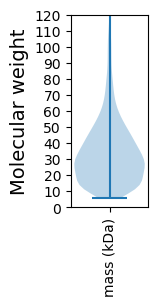
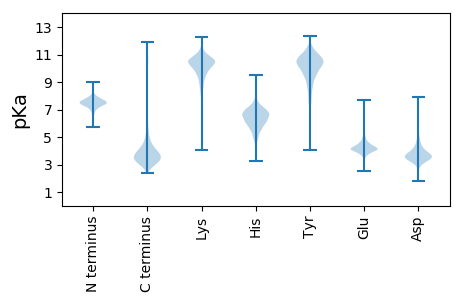
Summary statistics related to proteome-wise predictions


Protein with the lowest isoelectric point:
>tr|A0A1E7PY70|A0A1E7PY70_9ALTE Peptide chain release factor 1 OS=Marinobacter sp. X15-166B OX=1897620 GN=prfA PE=3 SV=1
MM1 pKa = 7.61KK2 pKa = 10.51KK3 pKa = 10.24LLQGVALVSTAAVCQTASALVIDD26 pKa = 4.47ATSTDD31 pKa = 3.38GTAMANALLGSGVTISNANYY51 pKa = 9.73IGGPNQSGFFSDD63 pKa = 4.27GAAVLNIDD71 pKa = 4.41EE72 pKa = 4.59GLIMTTGDD80 pKa = 3.18ATDD83 pKa = 3.63APGPNSAGGTTTVVGGAGDD102 pKa = 4.29ADD104 pKa = 4.34LSALIGGATTNDD116 pKa = 3.42AAVLTFDD123 pKa = 4.24FTTTTGDD130 pKa = 3.47LFFNYY135 pKa = 9.06VFASEE140 pKa = 4.71EE141 pKa = 3.94YY142 pKa = 10.01NEE144 pKa = 4.35FVGTQFNDD152 pKa = 2.83VFAFFVNGVNIAEE165 pKa = 4.66APDD168 pKa = 3.96GQPVSINNVNCGNPFSGAGPNCDD191 pKa = 3.46FYY193 pKa = 11.9NNNEE197 pKa = 4.06TGVFDD202 pKa = 3.98IEE204 pKa = 4.33YY205 pKa = 10.72DD206 pKa = 3.38GFTDD210 pKa = 3.79VFTASVLGLDD220 pKa = 4.04PEE222 pKa = 4.72ATHH225 pKa = 6.34SMKK228 pKa = 10.33IAIADD233 pKa = 3.86TGDD236 pKa = 3.76SSWDD240 pKa = 3.31SAVFLQGGSFTDD252 pKa = 3.74APPPVSTVPEE262 pKa = 4.61PGSLALMLLGLGGLLANRR280 pKa = 11.84RR281 pKa = 11.84RR282 pKa = 11.84LHH284 pKa = 5.57SS285 pKa = 3.76
MM1 pKa = 7.61KK2 pKa = 10.51KK3 pKa = 10.24LLQGVALVSTAAVCQTASALVIDD26 pKa = 4.47ATSTDD31 pKa = 3.38GTAMANALLGSGVTISNANYY51 pKa = 9.73IGGPNQSGFFSDD63 pKa = 4.27GAAVLNIDD71 pKa = 4.41EE72 pKa = 4.59GLIMTTGDD80 pKa = 3.18ATDD83 pKa = 3.63APGPNSAGGTTTVVGGAGDD102 pKa = 4.29ADD104 pKa = 4.34LSALIGGATTNDD116 pKa = 3.42AAVLTFDD123 pKa = 4.24FTTTTGDD130 pKa = 3.47LFFNYY135 pKa = 9.06VFASEE140 pKa = 4.71EE141 pKa = 3.94YY142 pKa = 10.01NEE144 pKa = 4.35FVGTQFNDD152 pKa = 2.83VFAFFVNGVNIAEE165 pKa = 4.66APDD168 pKa = 3.96GQPVSINNVNCGNPFSGAGPNCDD191 pKa = 3.46FYY193 pKa = 11.9NNNEE197 pKa = 4.06TGVFDD202 pKa = 3.98IEE204 pKa = 4.33YY205 pKa = 10.72DD206 pKa = 3.38GFTDD210 pKa = 3.79VFTASVLGLDD220 pKa = 4.04PEE222 pKa = 4.72ATHH225 pKa = 6.34SMKK228 pKa = 10.33IAIADD233 pKa = 3.86TGDD236 pKa = 3.76SSWDD240 pKa = 3.31SAVFLQGGSFTDD252 pKa = 3.74APPPVSTVPEE262 pKa = 4.61PGSLALMLLGLGGLLANRR280 pKa = 11.84RR281 pKa = 11.84RR282 pKa = 11.84LHH284 pKa = 5.57SS285 pKa = 3.76
Molecular weight: 29.03 kDa
Isoelectric point according different methods:
Protein with the highest isoelectric point:
>tr|A0A1E7PY37|A0A1E7PY37_9ALTE Uncharacterized protein OS=Marinobacter sp. X15-166B OX=1897620 GN=BG841_09940 PE=4 SV=1
MM1 pKa = 7.48TSFFALQQRR10 pKa = 11.84SRR12 pKa = 11.84KK13 pKa = 9.56RR14 pKa = 11.84IHH16 pKa = 5.48QQWPGLRR23 pKa = 11.84PLAATGEE30 pKa = 4.12QLVNGTRR37 pKa = 11.84ASRR40 pKa = 11.84GTGGRR45 pKa = 11.84RR46 pKa = 11.84HH47 pKa = 6.54LSWLNNQLSRR57 pKa = 11.84NPLTNQRR64 pKa = 11.84NNSRR68 pKa = 11.84YY69 pKa = 9.57HH70 pKa = 5.93NKK72 pKa = 9.32QVQQRR77 pKa = 11.84RR78 pKa = 11.84MATTQRR84 pKa = 11.84VRR86 pKa = 11.84QQ87 pKa = 3.63
MM1 pKa = 7.48TSFFALQQRR10 pKa = 11.84SRR12 pKa = 11.84KK13 pKa = 9.56RR14 pKa = 11.84IHH16 pKa = 5.48QQWPGLRR23 pKa = 11.84PLAATGEE30 pKa = 4.12QLVNGTRR37 pKa = 11.84ASRR40 pKa = 11.84GTGGRR45 pKa = 11.84RR46 pKa = 11.84HH47 pKa = 6.54LSWLNNQLSRR57 pKa = 11.84NPLTNQRR64 pKa = 11.84NNSRR68 pKa = 11.84YY69 pKa = 9.57HH70 pKa = 5.93NKK72 pKa = 9.32QVQQRR77 pKa = 11.84RR78 pKa = 11.84MATTQRR84 pKa = 11.84VRR86 pKa = 11.84QQ87 pKa = 3.63
Molecular weight: 10.24 kDa
Isoelectric point according different methods:
Peptides (in silico digests for buttom-up proteomics)
Below you can find in silico digests of the whole proteome with Trypsin, Chymotrypsin, Trypsin+LysC, LysN, ArgC proteases suitable for different mass spec machines.| Try ESI |
 |
|---|
| ChTry ESI |
 |
|---|
| ArgC ESI |
 |
|---|
| LysN ESI |
 |
|---|
| TryLysC ESI |
 |
|---|
| Try MALDI |
 |
|---|
| ChTry MALDI |
 |
|---|
| ArgC MALDI |
 |
|---|
| LysN MALDI |
 |
|---|
| TryLysC MALDI |
 |
|---|
| Try LTQ |
 |
|---|
| ChTry LTQ |
 |
|---|
| ArgC LTQ |
 |
|---|
| LysN LTQ |
 |
|---|
| TryLysC LTQ |
 |
|---|
| Try MSlow |
 |
|---|
| ChTry MSlow |
 |
|---|
| ArgC MSlow |
 |
|---|
| LysN MSlow |
 |
|---|
| TryLysC MSlow |
 |
|---|
| Try MShigh |
 |
|---|
| ChTry MShigh |
 |
|---|
| ArgC MShigh |
 |
|---|
| LysN MShigh |
 |
|---|
| TryLysC MShigh |
 |
|---|
General Statistics
Number of major isoforms |
Number of additional isoforms |
Number of all proteins |
Number of amino acids |
Min. Seq. Length |
Max. Seq. Length |
Avg. Seq. Length |
Avg. Mol. Weight |
|---|---|---|---|---|---|---|---|
0 |
999817 |
51 |
2469 |
321.0 |
35.21 |
Amino acid frequency
Ala |
Cys |
Asp |
Glu |
Phe |
Gly |
His |
Ile |
Lys |
Leu |
|---|---|---|---|---|---|---|---|---|---|
10.863 ± 0.044 | 0.941 ± 0.014 |
5.576 ± 0.033 | 5.909 ± 0.04 |
3.63 ± 0.03 | 7.973 ± 0.04 |
2.337 ± 0.02 | 5.061 ± 0.035 |
3.134 ± 0.034 | 10.868 ± 0.056 |
Met |
Asn |
Gln |
Pro |
Arg |
Ser |
Thr |
Val |
Trp |
Tyr |
|---|---|---|---|---|---|---|---|---|---|
2.501 ± 0.02 | 3.069 ± 0.028 |
4.789 ± 0.032 | 4.312 ± 0.029 |
6.638 ± 0.037 | 5.51 ± 0.027 |
5.437 ± 0.03 | 7.556 ± 0.038 |
1.334 ± 0.017 | 2.563 ± 0.024 |
Most of the basic statistics you can see at this page can be downloaded from this CSV file
Proteome-pI is available under Creative Commons Attribution-NoDerivs license, for more details see here
| Reference: Kozlowski LP. Proteome-pI 2.0: Proteome Isoelectric Point Database Update. Nucleic Acids Res. 2021, doi: 10.1093/nar/gkab944 | Contact: Lukasz P. Kozlowski |
