Arthroderma gypseum (strain ATCC MYA-4604 / CBS 118893) (Microsporum gypseum)
Taxonomy: cellular organisms; Eukaryota; Opisthokonta; Fungi; Dikarya; Ascomycota; saccharomyceta; Pezizomycotina; leotiomyceta; Eurotiomycetes; Eurotiomycetidae; Onygenales; Arthrodermataceae; Nannizzia; Nannizzia gypsea
Average proteome isoelectric point is 6.72
Get precalculated fractions of proteins

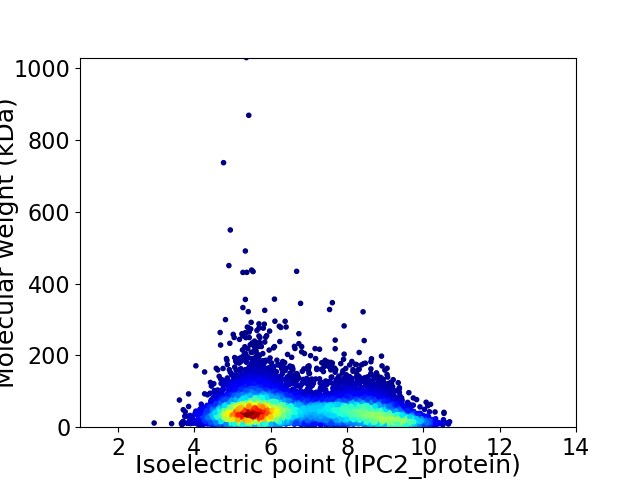
Virtual 2D-PAGE plot for 8921 proteins (isoelectric point calculated using IPC2_protein)
Get csv file with sequences according to given criteria:
* You can choose from 21 different methods for calculating isoelectric point
Summary statistics related to proteome-wise predictions


Protein with the lowest isoelectric point:
>tr|E4UR97|E4UR97_ARTGP NADH:ubiquinone reductase (non-electrogenic) OS=Arthroderma gypseum (strain ATCC MYA-4604 / CBS 118893) OX=535722 GN=MGYG_03165 PE=3 SV=1
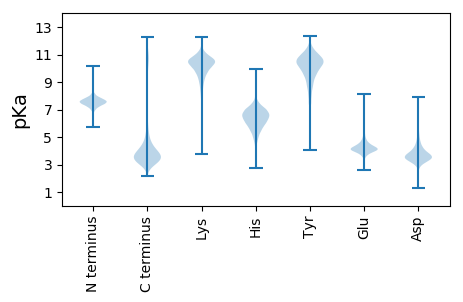
MM1 pKa = 7.61RR2 pKa = 11.84FSFVSLILASAAFVSAAKK20 pKa = 9.78MGDD23 pKa = 3.02IIGTVNTDD31 pKa = 3.66DD32 pKa = 3.79NCASEE37 pKa = 5.73GVDD40 pKa = 5.39LLDD43 pKa = 3.85STCTASSKK51 pKa = 10.93GSINVTADD59 pKa = 3.48TILCFAYY66 pKa = 9.63PDD68 pKa = 4.35SEE70 pKa = 4.7CKK72 pKa = 10.06TSTTTPDD79 pKa = 2.85GVYY82 pKa = 10.44LEE84 pKa = 4.88KK85 pKa = 11.01GCNVDD90 pKa = 3.7EE91 pKa = 4.99KK92 pKa = 11.18LSEE95 pKa = 4.6DD96 pKa = 4.22DD97 pKa = 5.41VSLLCYY103 pKa = 10.43AA104 pKa = 4.95
MM1 pKa = 7.61RR2 pKa = 11.84FSFVSLILASAAFVSAAKK20 pKa = 9.78MGDD23 pKa = 3.02IIGTVNTDD31 pKa = 3.66DD32 pKa = 3.79NCASEE37 pKa = 5.73GVDD40 pKa = 5.39LLDD43 pKa = 3.85STCTASSKK51 pKa = 10.93GSINVTADD59 pKa = 3.48TILCFAYY66 pKa = 9.63PDD68 pKa = 4.35SEE70 pKa = 4.7CKK72 pKa = 10.06TSTTTPDD79 pKa = 2.85GVYY82 pKa = 10.44LEE84 pKa = 4.88KK85 pKa = 11.01GCNVDD90 pKa = 3.7EE91 pKa = 4.99KK92 pKa = 11.18LSEE95 pKa = 4.6DD96 pKa = 4.22DD97 pKa = 5.41VSLLCYY103 pKa = 10.43AA104 pKa = 4.95
Molecular weight: 10.91 kDa
Isoelectric point according different methods:
Protein with the highest isoelectric point:
>tr|E5QZN5|E5QZN5_ARTGP Uncharacterized protein OS=Arthroderma gypseum (strain ATCC MYA-4604 / CBS 118893) OX=535722 GN=MGYG_01222 PE=3 SV=1
MM1 pKa = 7.53SPPEE5 pKa = 3.72PVAQRR10 pKa = 11.84FRR12 pKa = 11.84NLVWRR17 pKa = 11.84EE18 pKa = 3.13RR19 pKa = 11.84SLRR22 pKa = 11.84FTCEE26 pKa = 3.06NFLRR30 pKa = 11.84LTVFPSFRR38 pKa = 11.84GKK40 pKa = 8.14QTGQAEE46 pKa = 4.58SVEE49 pKa = 4.37GEE51 pKa = 4.37HH52 pKa = 6.03EE53 pKa = 4.32NKK55 pKa = 10.29RR56 pKa = 11.84ADD58 pKa = 3.37YY59 pKa = 11.05GNRR62 pKa = 11.84KK63 pKa = 5.68TKK65 pKa = 9.83RR66 pKa = 11.84RR67 pKa = 11.84RR68 pKa = 11.84RR69 pKa = 11.84RR70 pKa = 11.84RR71 pKa = 11.84NGSKK75 pKa = 8.77TANFVALRR83 pKa = 11.84TTLACCAARR92 pKa = 11.84LLDD95 pKa = 3.63INSYY99 pKa = 10.95LDD101 pKa = 3.37AGRR104 pKa = 11.84KK105 pKa = 7.14EE106 pKa = 3.95SRR108 pKa = 11.84KK109 pKa = 10.18AFWGWCSIIKK119 pKa = 10.13HH120 pKa = 5.36DD121 pKa = 4.34TCNKK125 pKa = 5.61PTPYY129 pKa = 10.97
MM1 pKa = 7.53SPPEE5 pKa = 3.72PVAQRR10 pKa = 11.84FRR12 pKa = 11.84NLVWRR17 pKa = 11.84EE18 pKa = 3.13RR19 pKa = 11.84SLRR22 pKa = 11.84FTCEE26 pKa = 3.06NFLRR30 pKa = 11.84LTVFPSFRR38 pKa = 11.84GKK40 pKa = 8.14QTGQAEE46 pKa = 4.58SVEE49 pKa = 4.37GEE51 pKa = 4.37HH52 pKa = 6.03EE53 pKa = 4.32NKK55 pKa = 10.29RR56 pKa = 11.84ADD58 pKa = 3.37YY59 pKa = 11.05GNRR62 pKa = 11.84KK63 pKa = 5.68TKK65 pKa = 9.83RR66 pKa = 11.84RR67 pKa = 11.84RR68 pKa = 11.84RR69 pKa = 11.84RR70 pKa = 11.84RR71 pKa = 11.84NGSKK75 pKa = 8.77TANFVALRR83 pKa = 11.84TTLACCAARR92 pKa = 11.84LLDD95 pKa = 3.63INSYY99 pKa = 10.95LDD101 pKa = 3.37AGRR104 pKa = 11.84KK105 pKa = 7.14EE106 pKa = 3.95SRR108 pKa = 11.84KK109 pKa = 10.18AFWGWCSIIKK119 pKa = 10.13HH120 pKa = 5.36DD121 pKa = 4.34TCNKK125 pKa = 5.61PTPYY129 pKa = 10.97
Molecular weight: 15.08 kDa
Isoelectric point according different methods:
Peptides (in silico digests for buttom-up proteomics)
Below you can find in silico digests of the whole proteome with Trypsin, Chymotrypsin, Trypsin+LysC, LysN, ArgC proteases suitable for different mass spec machines.| Try ESI |
 |
|---|
| ChTry ESI |
 |
|---|
| ArgC ESI |
 |
|---|
| LysN ESI |
 |
|---|
| TryLysC ESI |
 |
|---|
| Try MALDI |
 |
|---|
| ChTry MALDI |
 |
|---|
| ArgC MALDI |
 |
|---|
| LysN MALDI |
 |
|---|
| TryLysC MALDI |
 |
|---|
| Try LTQ |
 |
|---|
| ChTry LTQ |
 |
|---|
| ArgC LTQ |
 |
|---|
| LysN LTQ |
 |
|---|
| TryLysC LTQ |
 |
|---|
| Try MSlow |
 |
|---|
| ChTry MSlow |
 |
|---|
| ArgC MSlow |
 |
|---|
| LysN MSlow |
 |
|---|
| TryLysC MSlow |
 |
|---|
| Try MShigh |
 |
|---|
| ChTry MShigh |
 |
|---|
| ArgC MShigh |
 |
|---|
| LysN MShigh |
 |
|---|
| TryLysC MShigh |
 |
|---|
General Statistics
Number of major isoforms |
Number of additional isoforms |
Number of all proteins |
Number of amino acids |
Min. Seq. Length |
Max. Seq. Length |
Avg. Seq. Length |
Avg. Mol. Weight |
|---|---|---|---|---|---|---|---|
0 |
4257366 |
35 |
9330 |
477.2 |
52.89 |
Amino acid frequency
Ala |
Cys |
Asp |
Glu |
Phe |
Gly |
His |
Ile |
Lys |
Leu |
|---|---|---|---|---|---|---|---|---|---|
8.201 ± 0.026 | 1.263 ± 0.011 |
5.596 ± 0.019 | 6.268 ± 0.025 |
3.623 ± 0.018 | 6.669 ± 0.02 |
2.419 ± 0.012 | 5.153 ± 0.02 |
5.153 ± 0.023 | 8.847 ± 0.029 |
Met |
Asn |
Gln |
Pro |
Arg |
Ser |
Thr |
Val |
Trp |
Tyr |
|---|---|---|---|---|---|---|---|---|---|
2.134 ± 0.01 | 3.803 ± 0.013 |
6.143 ± 0.03 | 4.102 ± 0.022 |
6.146 ± 0.022 | 8.669 ± 0.032 |
5.903 ± 0.018 | 5.831 ± 0.017 |
1.327 ± 0.009 | 2.75 ± 0.013 |
Most of the basic statistics you can see at this page can be downloaded from this CSV file
Proteome-pI is available under Creative Commons Attribution-NoDerivs license, for more details see here
| Reference: Kozlowski LP. Proteome-pI 2.0: Proteome Isoelectric Point Database Update. Nucleic Acids Res. 2021, doi: 10.1093/nar/gkab944 | Contact: Lukasz P. Kozlowski |
