Gloeophyllum trabeum (strain ATCC 11539 / FP-39264 / Madison 617) (Brown rot fungus)
Taxonomy: cellular organisms; Eukaryota; Opisthokonta; Fungi; Dikarya; Basidiomycota; Agaricomycotina; Agaricomycetes; Agaricomycetes incertae sedis; Gloeophyllales; Gloeophyllaceae; Gloeophyllum; Gloeophyllum trabeum
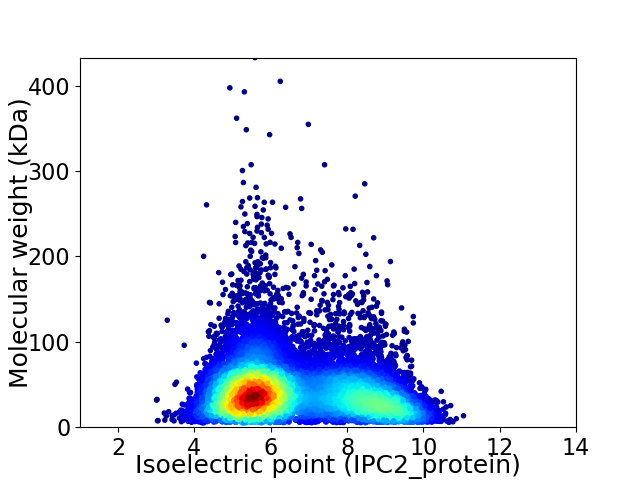
Average proteome isoelectric point is 6.59
Get precalculated fractions of proteins

Virtual 2D-PAGE plot for 11735 proteins (isoelectric point calculated using IPC2_protein)
Get csv file with sequences according to given criteria:
* You can choose from 21 different methods for calculating isoelectric point
Summary statistics related to proteome-wise predictions


Protein with the lowest isoelectric point:
>tr|S7Q1H5|S7Q1H5_GLOTA Uncharacterized protein OS=Gloeophyllum trabeum (strain ATCC 11539 / FP-39264 / Madison 617) OX=670483 GN=GLOTRDRAFT_131151 PE=4 SV=1
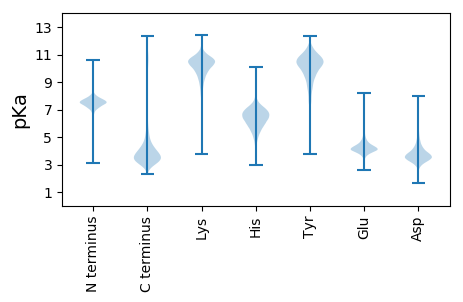
MM1 pKa = 7.22GAYY4 pKa = 9.64YY5 pKa = 10.51DD6 pKa = 4.14EE7 pKa = 5.9IEE9 pKa = 4.69IEE11 pKa = 4.12DD12 pKa = 4.11MAWDD16 pKa = 3.75EE17 pKa = 4.39AKK19 pKa = 10.54GVYY22 pKa = 9.48HH23 pKa = 5.99YY24 pKa = 8.22PCPCGDD30 pKa = 3.21RR31 pKa = 11.84FEE33 pKa = 5.22ISRR36 pKa = 11.84QQLRR40 pKa = 11.84DD41 pKa = 3.44YY42 pKa = 11.03EE43 pKa = 5.37DD44 pKa = 3.51IATCPSCSLIIRR56 pKa = 11.84VIYY59 pKa = 10.38DD60 pKa = 3.49PLDD63 pKa = 3.86FQDD66 pKa = 6.21DD67 pKa = 3.8DD68 pKa = 6.63DD69 pKa = 4.97EE70 pKa = 5.1DD71 pKa = 3.72QGSGEE76 pKa = 4.38GEE78 pKa = 4.03VKK80 pKa = 10.38EE81 pKa = 4.33SEE83 pKa = 4.34EE84 pKa = 4.32SGSEE88 pKa = 3.96SGDD91 pKa = 3.47EE92 pKa = 4.01QFEE95 pKa = 4.27DD96 pKa = 3.82ALEE99 pKa = 4.09KK100 pKa = 11.27LEE102 pKa = 4.18ISEE105 pKa = 4.46GPQVIAAAAA114 pKa = 3.55
MM1 pKa = 7.22GAYY4 pKa = 9.64YY5 pKa = 10.51DD6 pKa = 4.14EE7 pKa = 5.9IEE9 pKa = 4.69IEE11 pKa = 4.12DD12 pKa = 4.11MAWDD16 pKa = 3.75EE17 pKa = 4.39AKK19 pKa = 10.54GVYY22 pKa = 9.48HH23 pKa = 5.99YY24 pKa = 8.22PCPCGDD30 pKa = 3.21RR31 pKa = 11.84FEE33 pKa = 5.22ISRR36 pKa = 11.84QQLRR40 pKa = 11.84DD41 pKa = 3.44YY42 pKa = 11.03EE43 pKa = 5.37DD44 pKa = 3.51IATCPSCSLIIRR56 pKa = 11.84VIYY59 pKa = 10.38DD60 pKa = 3.49PLDD63 pKa = 3.86FQDD66 pKa = 6.21DD67 pKa = 3.8DD68 pKa = 6.63DD69 pKa = 4.97EE70 pKa = 5.1DD71 pKa = 3.72QGSGEE76 pKa = 4.38GEE78 pKa = 4.03VKK80 pKa = 10.38EE81 pKa = 4.33SEE83 pKa = 4.34EE84 pKa = 4.32SGSEE88 pKa = 3.96SGDD91 pKa = 3.47EE92 pKa = 4.01QFEE95 pKa = 4.27DD96 pKa = 3.82ALEE99 pKa = 4.09KK100 pKa = 11.27LEE102 pKa = 4.18ISEE105 pKa = 4.46GPQVIAAAAA114 pKa = 3.55
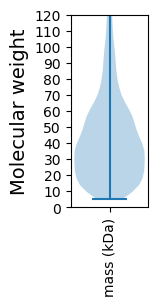
Molecular weight: 12.77 kDa
Isoelectric point according different methods:
Protein with the highest isoelectric point:
>tr|S7QDD6|S7QDD6_GLOTA ATP synthase subunit 5 mitochondrial OS=Gloeophyllum trabeum (strain ATCC 11539 / FP-39264 / Madison 617) OX=670483 GN=GLOTRDRAFT_137737 PE=3 SV=1
MM1 pKa = 7.47PRR3 pKa = 11.84IFRR6 pKa = 11.84QVALALARR14 pKa = 11.84PPTLSQASSTVSSLLQSQRR33 pKa = 11.84LSTPRR38 pKa = 11.84PTVLAPSIAFQSHH51 pKa = 5.94SLLAPTFTGLPSALLRR67 pKa = 11.84LNQVRR72 pKa = 11.84WGSRR76 pKa = 11.84GTEE79 pKa = 3.93YY80 pKa = 10.77QPSQRR85 pKa = 11.84VRR87 pKa = 11.84KK88 pKa = 9.28RR89 pKa = 11.84RR90 pKa = 11.84HH91 pKa = 4.87GFLARR96 pKa = 11.84KK97 pKa = 9.53KK98 pKa = 9.03SQHH101 pKa = 5.36GPKK104 pKa = 9.63ILARR108 pKa = 11.84RR109 pKa = 11.84RR110 pKa = 11.84AKK112 pKa = 9.85GRR114 pKa = 11.84KK115 pKa = 8.43FLSHH119 pKa = 6.98
MM1 pKa = 7.47PRR3 pKa = 11.84IFRR6 pKa = 11.84QVALALARR14 pKa = 11.84PPTLSQASSTVSSLLQSQRR33 pKa = 11.84LSTPRR38 pKa = 11.84PTVLAPSIAFQSHH51 pKa = 5.94SLLAPTFTGLPSALLRR67 pKa = 11.84LNQVRR72 pKa = 11.84WGSRR76 pKa = 11.84GTEE79 pKa = 3.93YY80 pKa = 10.77QPSQRR85 pKa = 11.84VRR87 pKa = 11.84KK88 pKa = 9.28RR89 pKa = 11.84RR90 pKa = 11.84HH91 pKa = 4.87GFLARR96 pKa = 11.84KK97 pKa = 9.53KK98 pKa = 9.03SQHH101 pKa = 5.36GPKK104 pKa = 9.63ILARR108 pKa = 11.84RR109 pKa = 11.84RR110 pKa = 11.84AKK112 pKa = 9.85GRR114 pKa = 11.84KK115 pKa = 8.43FLSHH119 pKa = 6.98
Molecular weight: 13.36 kDa
Isoelectric point according different methods:
Peptides (in silico digests for buttom-up proteomics)
Below you can find in silico digests of the whole proteome with Trypsin, Chymotrypsin, Trypsin+LysC, LysN, ArgC proteases suitable for different mass spec machines.| Try ESI |
 |
|---|
| ChTry ESI |
 |
|---|
| ArgC ESI |
 |
|---|
| LysN ESI |
 |
|---|
| TryLysC ESI |
 |
|---|
| Try MALDI |
 |
|---|
| ChTry MALDI |
 |
|---|
| ArgC MALDI |
 |
|---|
| LysN MALDI |
 |
|---|
| TryLysC MALDI |
 |
|---|
| Try LTQ |
 |
|---|
| ChTry LTQ |
 |
|---|
| ArgC LTQ |
 |
|---|
| LysN LTQ |
 |
|---|
| TryLysC LTQ |
 |
|---|
| Try MSlow |
 |
|---|
| ChTry MSlow |
 |
|---|
| ArgC MSlow |
 |
|---|
| LysN MSlow |
 |
|---|
| TryLysC MSlow |
 |
|---|
| Try MShigh |
 |
|---|
| ChTry MShigh |
 |
|---|
| ArgC MShigh |
 |
|---|
| LysN MShigh |
 |
|---|
| TryLysC MShigh |
 |
|---|
General Statistics
Number of major isoforms |
Number of additional isoforms |
Number of all proteins |
Number of amino acids |
Min. Seq. Length |
Max. Seq. Length |
Avg. Seq. Length |
Avg. Mol. Weight |
|---|---|---|---|---|---|---|---|
0 |
4956750 |
49 |
3936 |
422.4 |
46.66 |
Amino acid frequency
Ala |
Cys |
Asp |
Glu |
Phe |
Gly |
His |
Ile |
Lys |
Leu |
|---|---|---|---|---|---|---|---|---|---|
8.96 ± 0.022 | 1.245 ± 0.009 |
5.615 ± 0.016 | 6.187 ± 0.022 |
3.554 ± 0.013 | 6.784 ± 0.019 |
2.468 ± 0.011 | 4.553 ± 0.016 |
4.513 ± 0.02 | 9.171 ± 0.025 |
Met |
Asn |
Gln |
Pro |
Arg |
Ser |
Thr |
Val |
Trp |
Tyr |
|---|---|---|---|---|---|---|---|---|---|
2.088 ± 0.009 | 3.164 ± 0.012 |
6.602 ± 0.03 | 3.673 ± 0.014 |
6.506 ± 0.019 | 8.343 ± 0.032 |
5.766 ± 0.015 | 6.54 ± 0.016 |
1.499 ± 0.009 | 2.769 ± 0.01 |
Most of the basic statistics you can see at this page can be downloaded from this CSV file
Proteome-pI is available under Creative Commons Attribution-NoDerivs license, for more details see here
| Reference: Kozlowski LP. Proteome-pI 2.0: Proteome Isoelectric Point Database Update. Nucleic Acids Res. 2021, doi: 10.1093/nar/gkab944 | Contact: Lukasz P. Kozlowski |
