Lutibacter profundi
Taxonomy: cellular organisms; Bacteria; FCB group; Bacteroidetes/Chlorobi group; Bacteroidetes; Flavobacteriia; Flavobacteriales; Flavobacteriaceae; Lutibacter
Average proteome isoelectric point is 7.33
Get precalculated fractions of proteins

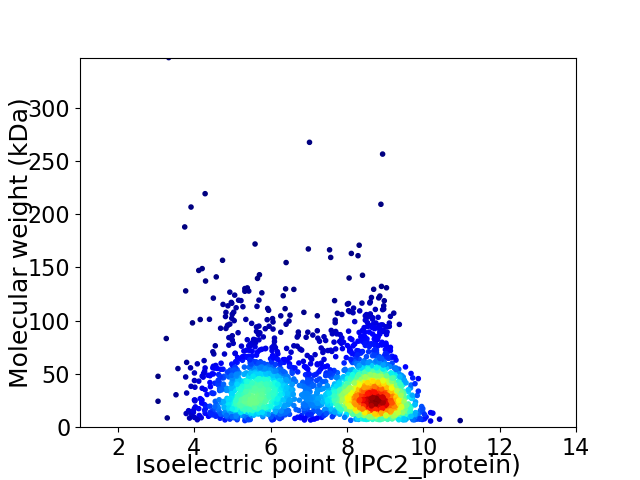
Virtual 2D-PAGE plot for 2525 proteins (isoelectric point calculated using IPC2_protein)
Get csv file with sequences according to given criteria:
* You can choose from 21 different methods for calculating isoelectric point
Summary statistics related to proteome-wise predictions


Protein with the lowest isoelectric point:
>tr|A0A0X8G650|A0A0X8G650_9FLAO Dihydrofolate reductase OS=Lutibacter profundi OX=1622118 GN=Lupro_05960 PE=4 SV=1
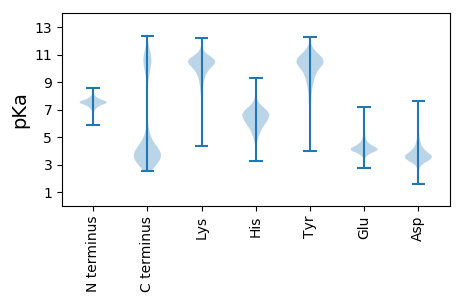
MM1 pKa = 7.43KK2 pKa = 10.43KK3 pKa = 10.11IINKK7 pKa = 9.46LLIIALVFSTVMSCKK22 pKa = 10.74DD23 pKa = 3.88PDD25 pKa = 3.49NAIYY29 pKa = 10.61DD30 pKa = 3.84VFDD33 pKa = 3.93GVSYY37 pKa = 10.64GAVIRR42 pKa = 11.84TLDD45 pKa = 3.44RR46 pKa = 11.84VSTNYY51 pKa = 10.78NIFDD55 pKa = 4.06LNSRR59 pKa = 11.84FEE61 pKa = 4.29IVVEE65 pKa = 4.25EE66 pKa = 3.91QDD68 pKa = 3.39EE69 pKa = 4.82EE70 pKa = 4.77YY71 pKa = 11.16GGLLDD76 pKa = 4.06KK77 pKa = 11.59VNVYY81 pKa = 9.85VSYY84 pKa = 10.8TDD86 pKa = 3.35KK87 pKa = 11.32TDD89 pKa = 4.33DD90 pKa = 3.8GVNNSKK96 pKa = 11.25AEE98 pKa = 3.92ILLKK102 pKa = 10.75SIAASEE108 pKa = 4.41FTTSANGLPSTTIAATFSEE127 pKa = 4.46ALAALGFTIGDD138 pKa = 3.6GNYY141 pKa = 10.5NGGDD145 pKa = 3.24EE146 pKa = 4.39FDD148 pKa = 4.1FRR150 pKa = 11.84LEE152 pKa = 4.06VVLTDD157 pKa = 3.61GRR159 pKa = 11.84SFSADD164 pKa = 3.41DD165 pKa = 4.37ASGSLQGSYY174 pKa = 10.42FKK176 pKa = 10.9SPYY179 pKa = 9.68AYY181 pKa = 10.36NVGILCIPDD190 pKa = 3.44SPITGDD196 pKa = 3.65YY197 pKa = 9.85VINMQDD203 pKa = 2.82SYY205 pKa = 11.89GDD207 pKa = 3.25GWQGSKK213 pKa = 9.96IVCTIDD219 pKa = 3.54GVEE222 pKa = 4.45NYY224 pKa = 10.87AFLPDD229 pKa = 3.67YY230 pKa = 9.93WSTGLGPFTDD240 pKa = 4.34GTATITVPAGASTVVWSFVAGDD262 pKa = 3.66WPSEE266 pKa = 3.82VSFQIIGPNSGNVIGDD282 pKa = 4.11FGPSPVEE289 pKa = 4.35GEE291 pKa = 4.36LALNLCNEE299 pKa = 4.33
MM1 pKa = 7.43KK2 pKa = 10.43KK3 pKa = 10.11IINKK7 pKa = 9.46LLIIALVFSTVMSCKK22 pKa = 10.74DD23 pKa = 3.88PDD25 pKa = 3.49NAIYY29 pKa = 10.61DD30 pKa = 3.84VFDD33 pKa = 3.93GVSYY37 pKa = 10.64GAVIRR42 pKa = 11.84TLDD45 pKa = 3.44RR46 pKa = 11.84VSTNYY51 pKa = 10.78NIFDD55 pKa = 4.06LNSRR59 pKa = 11.84FEE61 pKa = 4.29IVVEE65 pKa = 4.25EE66 pKa = 3.91QDD68 pKa = 3.39EE69 pKa = 4.82EE70 pKa = 4.77YY71 pKa = 11.16GGLLDD76 pKa = 4.06KK77 pKa = 11.59VNVYY81 pKa = 9.85VSYY84 pKa = 10.8TDD86 pKa = 3.35KK87 pKa = 11.32TDD89 pKa = 4.33DD90 pKa = 3.8GVNNSKK96 pKa = 11.25AEE98 pKa = 3.92ILLKK102 pKa = 10.75SIAASEE108 pKa = 4.41FTTSANGLPSTTIAATFSEE127 pKa = 4.46ALAALGFTIGDD138 pKa = 3.6GNYY141 pKa = 10.5NGGDD145 pKa = 3.24EE146 pKa = 4.39FDD148 pKa = 4.1FRR150 pKa = 11.84LEE152 pKa = 4.06VVLTDD157 pKa = 3.61GRR159 pKa = 11.84SFSADD164 pKa = 3.41DD165 pKa = 4.37ASGSLQGSYY174 pKa = 10.42FKK176 pKa = 10.9SPYY179 pKa = 9.68AYY181 pKa = 10.36NVGILCIPDD190 pKa = 3.44SPITGDD196 pKa = 3.65YY197 pKa = 9.85VINMQDD203 pKa = 2.82SYY205 pKa = 11.89GDD207 pKa = 3.25GWQGSKK213 pKa = 9.96IVCTIDD219 pKa = 3.54GVEE222 pKa = 4.45NYY224 pKa = 10.87AFLPDD229 pKa = 3.67YY230 pKa = 9.93WSTGLGPFTDD240 pKa = 4.34GTATITVPAGASTVVWSFVAGDD262 pKa = 3.66WPSEE266 pKa = 3.82VSFQIIGPNSGNVIGDD282 pKa = 4.11FGPSPVEE289 pKa = 4.35GEE291 pKa = 4.36LALNLCNEE299 pKa = 4.33
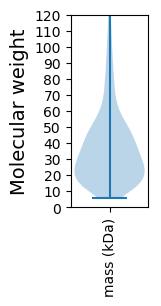
Molecular weight: 32.07 kDa
Isoelectric point according different methods:
Protein with the highest isoelectric point:
>tr|A0A109RMQ9|A0A109RMQ9_9FLAO Cystathionine beta-synthase OS=Lutibacter profundi OX=1622118 GN=Lupro_00950 PE=4 SV=1
MM1 pKa = 8.0PKK3 pKa = 9.06RR4 pKa = 11.84TFQPSKK10 pKa = 9.13RR11 pKa = 11.84KK12 pKa = 9.48RR13 pKa = 11.84RR14 pKa = 11.84NKK16 pKa = 9.49HH17 pKa = 3.94GFRR20 pKa = 11.84EE21 pKa = 4.24RR22 pKa = 11.84MASATGRR29 pKa = 11.84KK30 pKa = 8.64VLARR34 pKa = 11.84RR35 pKa = 11.84RR36 pKa = 11.84AKK38 pKa = 10.03GRR40 pKa = 11.84KK41 pKa = 7.95NLSVSSAPRR50 pKa = 11.84PKK52 pKa = 10.38KK53 pKa = 10.5
MM1 pKa = 8.0PKK3 pKa = 9.06RR4 pKa = 11.84TFQPSKK10 pKa = 9.13RR11 pKa = 11.84KK12 pKa = 9.48RR13 pKa = 11.84RR14 pKa = 11.84NKK16 pKa = 9.49HH17 pKa = 3.94GFRR20 pKa = 11.84EE21 pKa = 4.24RR22 pKa = 11.84MASATGRR29 pKa = 11.84KK30 pKa = 8.64VLARR34 pKa = 11.84RR35 pKa = 11.84RR36 pKa = 11.84AKK38 pKa = 10.03GRR40 pKa = 11.84KK41 pKa = 7.95NLSVSSAPRR50 pKa = 11.84PKK52 pKa = 10.38KK53 pKa = 10.5
Molecular weight: 6.2 kDa
Isoelectric point according different methods:
Peptides (in silico digests for buttom-up proteomics)
Below you can find in silico digests of the whole proteome with Trypsin, Chymotrypsin, Trypsin+LysC, LysN, ArgC proteases suitable for different mass spec machines.| Try ESI |
 |
|---|
| ChTry ESI |
 |
|---|
| ArgC ESI |
 |
|---|
| LysN ESI |
 |
|---|
| TryLysC ESI |
 |
|---|
| Try MALDI |
 |
|---|
| ChTry MALDI |
 |
|---|
| ArgC MALDI |
 |
|---|
| LysN MALDI |
 |
|---|
| TryLysC MALDI |
 |
|---|
| Try LTQ |
 |
|---|
| ChTry LTQ |
 |
|---|
| ArgC LTQ |
 |
|---|
| LysN LTQ |
 |
|---|
| TryLysC LTQ |
 |
|---|
| Try MSlow |
 |
|---|
| ChTry MSlow |
 |
|---|
| ArgC MSlow |
 |
|---|
| LysN MSlow |
 |
|---|
| TryLysC MSlow |
 |
|---|
| Try MShigh |
 |
|---|
| ChTry MShigh |
 |
|---|
| ArgC MShigh |
 |
|---|
| LysN MShigh |
 |
|---|
| TryLysC MShigh |
 |
|---|
General Statistics
Number of major isoforms |
Number of additional isoforms |
Number of all proteins |
Number of amino acids |
Min. Seq. Length |
Max. Seq. Length |
Avg. Seq. Length |
Avg. Mol. Weight |
|---|---|---|---|---|---|---|---|
0 |
871124 |
49 |
3371 |
345.0 |
39.03 |
Amino acid frequency
Ala |
Cys |
Asp |
Glu |
Phe |
Gly |
His |
Ile |
Lys |
Leu |
|---|---|---|---|---|---|---|---|---|---|
5.866 ± 0.045 | 0.701 ± 0.019 |
4.855 ± 0.041 | 6.352 ± 0.047 |
5.346 ± 0.045 | 6.144 ± 0.053 |
1.668 ± 0.021 | 9.115 ± 0.048 |
9.014 ± 0.075 | 9.236 ± 0.053 |
Met |
Asn |
Gln |
Pro |
Arg |
Ser |
Thr |
Val |
Trp |
Tyr |
|---|---|---|---|---|---|---|---|---|---|
2.038 ± 0.024 | 6.978 ± 0.049 |
3.196 ± 0.023 | 3.093 ± 0.028 |
3.049 ± 0.03 | 6.395 ± 0.04 |
5.933 ± 0.062 | 5.96 ± 0.038 |
0.979 ± 0.016 | 4.084 ± 0.033 |
Most of the basic statistics you can see at this page can be downloaded from this CSV file
Proteome-pI is available under Creative Commons Attribution-NoDerivs license, for more details see here
| Reference: Kozlowski LP. Proteome-pI 2.0: Proteome Isoelectric Point Database Update. Nucleic Acids Res. 2021, doi: 10.1093/nar/gkab944 | Contact: Lukasz P. Kozlowski |
