Sinirhodobacter hankyongi
Taxonomy: cellular organisms; Bacteria; Proteobacteria; Alphaproteobacteria; Rhodobacterales; Rhodobacteraceae; Sinirhodobacter
Average proteome isoelectric point is 6.43
Get precalculated fractions of proteins
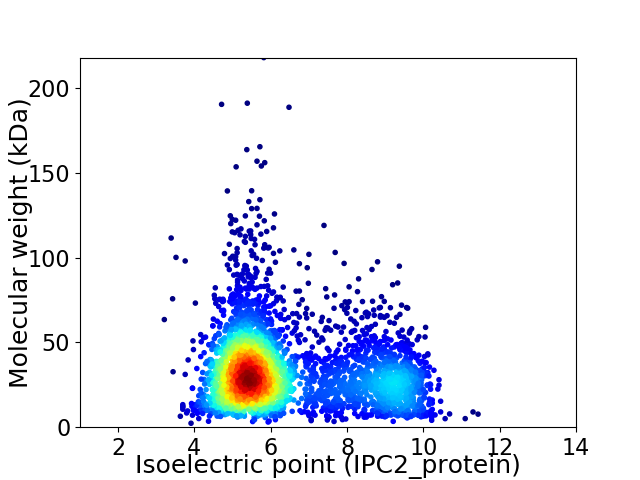
Virtual 2D-PAGE plot for 3573 proteins (isoelectric point calculated using IPC2_protein)
Get csv file with sequences according to given criteria:
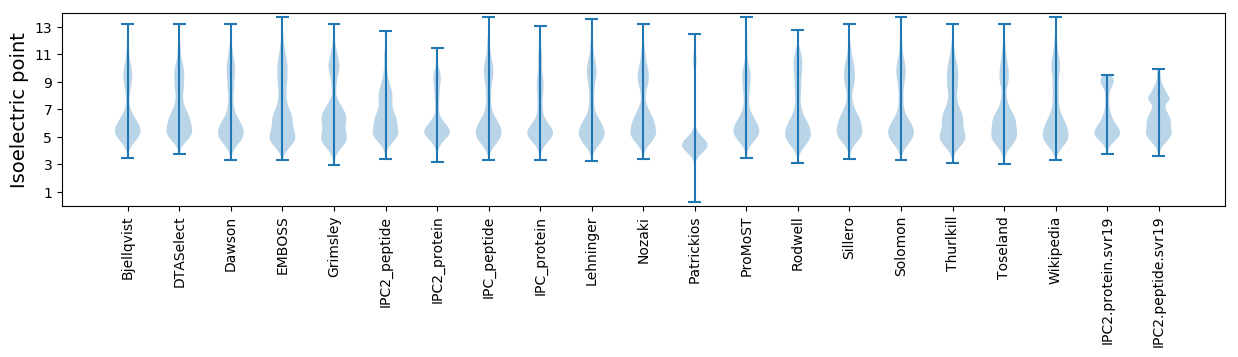
* You can choose from 21 different methods for calculating isoelectric point
Summary statistics related to proteome-wise predictions
Protein with the lowest isoelectric point:
>tr|A0A421BVH7|A0A421BVH7_9RHOB Uncharacterized protein OS=Sinirhodobacter hankyongi OX=2294033 GN=DYS74_02615 PE=4 SV=1
MM1 pKa = 7.44KK2 pKa = 10.19KK3 pKa = 10.41VLFATTALVFSAGFAAAEE21 pKa = 4.29VTLSGDD27 pKa = 2.64GRR29 pKa = 11.84MGVTYY34 pKa = 10.67NGSDD38 pKa = 3.05WNFSSRR44 pKa = 11.84ARR46 pKa = 11.84VTFTLSGQTDD56 pKa = 3.27SGLEE60 pKa = 3.86FGGSFRR66 pKa = 11.84ADD68 pKa = 3.14QAGDD72 pKa = 3.76SIANNGAAYY81 pKa = 8.16GTEE84 pKa = 3.68GSVYY88 pKa = 10.43VSGAFGKK95 pKa = 10.88LEE97 pKa = 4.01MGDD100 pKa = 3.46VVSAPEE106 pKa = 4.22ALFGDD111 pKa = 4.52LPEE114 pKa = 4.49VGYY117 pKa = 9.51TDD119 pKa = 5.38LVTSGAGLEE128 pKa = 4.0NDD130 pKa = 3.59IPYY133 pKa = 8.93LTLDD137 pKa = 3.96NNTQSALLYY146 pKa = 9.29TYY148 pKa = 9.09TAGAFSVAASLSDD161 pKa = 3.34GFVDD165 pKa = 4.09QTSVDD170 pKa = 3.32ANQAYY175 pKa = 9.27GVAAAYY181 pKa = 8.36TFGNYY186 pKa = 7.27TVGLGYY192 pKa = 10.76EE193 pKa = 4.22DD194 pKa = 5.47LEE196 pKa = 4.38LAAGGKK202 pKa = 6.62MTQAEE207 pKa = 4.48LAGVATFGDD216 pKa = 4.11TSVKK220 pKa = 10.28AYY222 pKa = 10.51YY223 pKa = 10.55AVGDD227 pKa = 4.31DD228 pKa = 5.23LNPVDD233 pKa = 3.94NSYY236 pKa = 11.34GLGVSSVFGATTVMGYY252 pKa = 7.08VQKK255 pKa = 11.37AEE257 pKa = 4.21FVGGADD263 pKa = 3.6VTWYY267 pKa = 10.93GLGAAYY273 pKa = 10.31DD274 pKa = 3.99LGGGASVVGGIADD287 pKa = 4.44DD288 pKa = 5.05DD289 pKa = 4.23IKK291 pKa = 11.43GSDD294 pKa = 3.52PVADD298 pKa = 4.38LGVKK302 pKa = 10.36FKK304 pKa = 11.05FF305 pKa = 3.81
MM1 pKa = 7.44KK2 pKa = 10.19KK3 pKa = 10.41VLFATTALVFSAGFAAAEE21 pKa = 4.29VTLSGDD27 pKa = 2.64GRR29 pKa = 11.84MGVTYY34 pKa = 10.67NGSDD38 pKa = 3.05WNFSSRR44 pKa = 11.84ARR46 pKa = 11.84VTFTLSGQTDD56 pKa = 3.27SGLEE60 pKa = 3.86FGGSFRR66 pKa = 11.84ADD68 pKa = 3.14QAGDD72 pKa = 3.76SIANNGAAYY81 pKa = 8.16GTEE84 pKa = 3.68GSVYY88 pKa = 10.43VSGAFGKK95 pKa = 10.88LEE97 pKa = 4.01MGDD100 pKa = 3.46VVSAPEE106 pKa = 4.22ALFGDD111 pKa = 4.52LPEE114 pKa = 4.49VGYY117 pKa = 9.51TDD119 pKa = 5.38LVTSGAGLEE128 pKa = 4.0NDD130 pKa = 3.59IPYY133 pKa = 8.93LTLDD137 pKa = 3.96NNTQSALLYY146 pKa = 9.29TYY148 pKa = 9.09TAGAFSVAASLSDD161 pKa = 3.34GFVDD165 pKa = 4.09QTSVDD170 pKa = 3.32ANQAYY175 pKa = 9.27GVAAAYY181 pKa = 8.36TFGNYY186 pKa = 7.27TVGLGYY192 pKa = 10.76EE193 pKa = 4.22DD194 pKa = 5.47LEE196 pKa = 4.38LAAGGKK202 pKa = 6.62MTQAEE207 pKa = 4.48LAGVATFGDD216 pKa = 4.11TSVKK220 pKa = 10.28AYY222 pKa = 10.51YY223 pKa = 10.55AVGDD227 pKa = 4.31DD228 pKa = 5.23LNPVDD233 pKa = 3.94NSYY236 pKa = 11.34GLGVSSVFGATTVMGYY252 pKa = 7.08VQKK255 pKa = 11.37AEE257 pKa = 4.21FVGGADD263 pKa = 3.6VTWYY267 pKa = 10.93GLGAAYY273 pKa = 10.31DD274 pKa = 3.99LGGGASVVGGIADD287 pKa = 4.44DD288 pKa = 5.05DD289 pKa = 4.23IKK291 pKa = 11.43GSDD294 pKa = 3.52PVADD298 pKa = 4.38LGVKK302 pKa = 10.36FKK304 pKa = 11.05FF305 pKa = 3.81
Molecular weight: 31.13 kDa
Isoelectric point according different methods:
Protein with the highest isoelectric point:
>tr|A0A421BXT2|A0A421BXT2_9RHOB Uncharacterized protein OS=Sinirhodobacter hankyongi OX=2294033 GN=DYS74_01890 PE=4 SV=1
MM1 pKa = 7.86PPRR4 pKa = 11.84TGPRR8 pKa = 11.84PKK10 pKa = 9.63ATRR13 pKa = 11.84KK14 pKa = 4.13TTPMRR19 pKa = 11.84RR20 pKa = 11.84SRR22 pKa = 11.84PRR24 pKa = 11.84SPRR27 pKa = 11.84PTRR30 pKa = 11.84MPRR33 pKa = 11.84SRR35 pKa = 11.84RR36 pKa = 11.84STRR39 pKa = 11.84CPRR42 pKa = 11.84RR43 pKa = 11.84KK44 pKa = 9.75RR45 pKa = 11.84PSLRR49 pKa = 11.84PRR51 pKa = 11.84KK52 pKa = 9.52APPKK56 pKa = 7.56ATRR59 pKa = 11.84WRR61 pKa = 11.84LPRR64 pKa = 11.84PLSPPRR70 pKa = 11.84RR71 pKa = 11.84ARR73 pKa = 11.84SRR75 pKa = 3.33
MM1 pKa = 7.86PPRR4 pKa = 11.84TGPRR8 pKa = 11.84PKK10 pKa = 9.63ATRR13 pKa = 11.84KK14 pKa = 4.13TTPMRR19 pKa = 11.84RR20 pKa = 11.84SRR22 pKa = 11.84PRR24 pKa = 11.84SPRR27 pKa = 11.84PTRR30 pKa = 11.84MPRR33 pKa = 11.84SRR35 pKa = 11.84RR36 pKa = 11.84STRR39 pKa = 11.84CPRR42 pKa = 11.84RR43 pKa = 11.84KK44 pKa = 9.75RR45 pKa = 11.84PSLRR49 pKa = 11.84PRR51 pKa = 11.84KK52 pKa = 9.52APPKK56 pKa = 7.56ATRR59 pKa = 11.84WRR61 pKa = 11.84LPRR64 pKa = 11.84PLSPPRR70 pKa = 11.84RR71 pKa = 11.84ARR73 pKa = 11.84SRR75 pKa = 3.33
Molecular weight: 8.99 kDa
Isoelectric point according different methods:
Peptides (in silico digests for buttom-up proteomics)
Below you can find in silico digests of the whole proteome with Trypsin, Chymotrypsin, Trypsin+LysC, LysN, ArgC proteases suitable for different mass spec machines.| Try ESI |
 |
|---|
| ChTry ESI |
|
|---|
| ArgC ESI |
|
|---|
| LysN ESI |
|
|---|
| TryLysC ESI |
|
|---|
| Try MALDI |
|
|---|
| ChTry MALDI |
|
|---|
| ArgC MALDI |
|
|---|
| LysN MALDI |
|
|---|
| TryLysC MALDI |
|
|---|
| Try LTQ |
|
|---|
| ChTry LTQ |
|
|---|
| ArgC LTQ |
|
|---|
| LysN LTQ |
|
|---|
| TryLysC LTQ |
|
|---|
| Try MSlow |
|
|---|
| ChTry MSlow |
|
|---|
| ArgC MSlow |
|
|---|
| LysN MSlow |
|
|---|
| TryLysC MSlow |
|
|---|
| Try MShigh |
|
|---|
| ChTry MShigh |
|
|---|
| ArgC MShigh |
|
|---|
| LysN MShigh |
|
|---|
| TryLysC MShigh |
|
|---|
General Statistics
Number of major isoforms |
Number of additional isoforms |
Number of all proteins |
Number of amino acids |
Min. Seq. Length |
Max. Seq. Length |
Avg. Seq. Length |
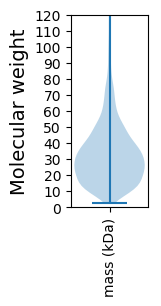
Avg. Mol. Weight |
|---|---|---|---|---|---|---|---|
0 |
1138740 |
22 |
1981 |
318.7 |
34.31 |
Amino acid frequency
Ala |
Cys |
Asp |
Glu |
Phe |
Gly |
His |
Ile |
Lys |
Leu |
|---|---|---|---|---|---|---|---|---|---|
14.029 ± 0.075 | 0.873 ± 0.014 |
5.366 ± 0.033 | 5.954 ± 0.039 |
3.601 ± 0.023 | 9.043 ± 0.038 |
1.973 ± 0.02 | 4.767 ± 0.032 |
2.828 ± 0.034 | 10.503 ± 0.053 |
Met |
Asn |
Gln |
Pro |
Arg |
Ser |
Thr |
Val |
Trp |
Tyr |
|---|---|---|---|---|---|---|---|---|---|
2.618 ± 0.02 | 2.143 ± 0.022 |
5.545 ± 0.037 | 2.776 ± 0.02 |
7.271 ± 0.039 | 4.595 ± 0.03 |
5.384 ± 0.025 | 7.279 ± 0.035 |
1.416 ± 0.017 | 2.037 ± 0.02 |
Most of the basic statistics you can see at this page can be downloaded from this CSV file
See this proteome in:

Proteome-pI is available under Creative Commons Attribution-NoDerivs license, for more details see here
| Reference: Kozlowski LP. Proteome-pI 2.0: Proteome Isoelectric Point Database Update. Nucleic Acids Res. 2021, doi: 10.1093/nar/gkab944 | Contact: Lukasz P. Kozlowski |