Methanothrix thermoacetophila (strain DSM 6194 / JCM 14653 / NBRC 101360 / PT) (Methanosaeta thermophila)
Taxonomy: cellular organisms; Archaea; Euryarchaeota; Stenosarchaea group; Methanomicrobia; Methanosarcinales; Methanotrichaceae; Methanothrix; Methanothrix thermoacetophila
Average proteome isoelectric point is 6.09
Get precalculated fractions of proteins
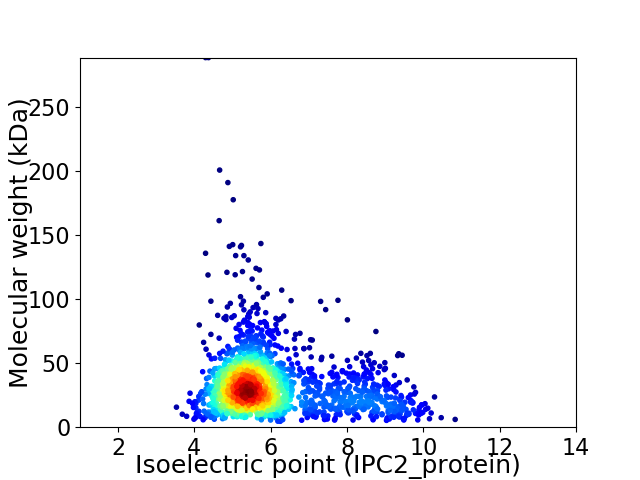
Virtual 2D-PAGE plot for 1673 proteins (isoelectric point calculated using IPC2_protein)
Get csv file with sequences according to given criteria:
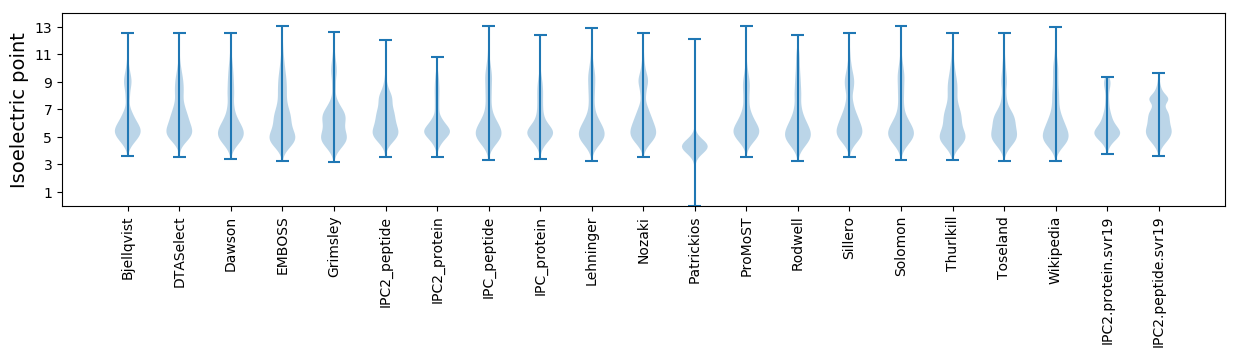
* You can choose from 21 different methods for calculating isoelectric point
Summary statistics related to proteome-wise predictions
Protein with the lowest isoelectric point:
>sp|A0B688|PRIS_METTP DNA primase small subunit PriS OS=Methanothrix thermoacetophila (strain DSM 6194 / JCM 14653 / NBRC 101360 / PT) OX=349307 GN=priS PE=3 SV=1
MM1 pKa = 7.44TIKK4 pKa = 10.49FKK6 pKa = 11.13SSNDD10 pKa = 3.93DD11 pKa = 3.23ISCEE15 pKa = 4.01GGIKK19 pKa = 9.13TRR21 pKa = 11.84ILILMAVLITVSSAVADD38 pKa = 3.84PSYY41 pKa = 10.88GSKK44 pKa = 10.25VLPYY48 pKa = 10.67DD49 pKa = 3.83ADD51 pKa = 3.52EE52 pKa = 4.49SRR54 pKa = 11.84ALSAFSSAPVFAYY67 pKa = 10.38SDD69 pKa = 3.56ANIRR73 pKa = 11.84GIFDD77 pKa = 3.12ISDD80 pKa = 3.5PVYY83 pKa = 10.74IDD85 pKa = 4.0VDD87 pKa = 3.81PSDD90 pKa = 4.4DD91 pKa = 3.62AVNEE95 pKa = 3.83NDD97 pKa = 3.88VRR99 pKa = 11.84LTPFGSYY106 pKa = 9.71PAGSQVRR113 pKa = 11.84LGDD116 pKa = 3.09QDD118 pKa = 3.61YY119 pKa = 10.5GYY121 pKa = 10.97KK122 pKa = 9.25LTPFGVSGMPGAQLVYY138 pKa = 10.38FDD140 pKa = 4.24VDD142 pKa = 2.87GDD144 pKa = 3.77EE145 pKa = 5.21AYY147 pKa = 10.97SIVDD151 pKa = 3.31PVYY154 pKa = 10.85LDD156 pKa = 3.28VGPEE160 pKa = 3.81YY161 pKa = 11.25GRR163 pKa = 11.84IDD165 pKa = 3.69AGDD168 pKa = 3.6VRR170 pKa = 11.84ITGYY174 pKa = 7.6MTLQAGTRR182 pKa = 11.84VRR184 pKa = 11.84DD185 pKa = 3.59SDD187 pKa = 3.99PDD189 pKa = 3.54NDD191 pKa = 3.72KK192 pKa = 10.45PAPVLPAMLCFMNLNGNINSGGWAIYY218 pKa = 9.91DD219 pKa = 3.32QGDD222 pKa = 4.08RR223 pKa = 11.84IYY225 pKa = 11.49VDD227 pKa = 3.29TQYY230 pKa = 11.44PFYY233 pKa = 10.14TVTVNDD239 pKa = 2.78IRR241 pKa = 11.84LFVV244 pKa = 3.49
MM1 pKa = 7.44TIKK4 pKa = 10.49FKK6 pKa = 11.13SSNDD10 pKa = 3.93DD11 pKa = 3.23ISCEE15 pKa = 4.01GGIKK19 pKa = 9.13TRR21 pKa = 11.84ILILMAVLITVSSAVADD38 pKa = 3.84PSYY41 pKa = 10.88GSKK44 pKa = 10.25VLPYY48 pKa = 10.67DD49 pKa = 3.83ADD51 pKa = 3.52EE52 pKa = 4.49SRR54 pKa = 11.84ALSAFSSAPVFAYY67 pKa = 10.38SDD69 pKa = 3.56ANIRR73 pKa = 11.84GIFDD77 pKa = 3.12ISDD80 pKa = 3.5PVYY83 pKa = 10.74IDD85 pKa = 4.0VDD87 pKa = 3.81PSDD90 pKa = 4.4DD91 pKa = 3.62AVNEE95 pKa = 3.83NDD97 pKa = 3.88VRR99 pKa = 11.84LTPFGSYY106 pKa = 9.71PAGSQVRR113 pKa = 11.84LGDD116 pKa = 3.09QDD118 pKa = 3.61YY119 pKa = 10.5GYY121 pKa = 10.97KK122 pKa = 9.25LTPFGVSGMPGAQLVYY138 pKa = 10.38FDD140 pKa = 4.24VDD142 pKa = 2.87GDD144 pKa = 3.77EE145 pKa = 5.21AYY147 pKa = 10.97SIVDD151 pKa = 3.31PVYY154 pKa = 10.85LDD156 pKa = 3.28VGPEE160 pKa = 3.81YY161 pKa = 11.25GRR163 pKa = 11.84IDD165 pKa = 3.69AGDD168 pKa = 3.6VRR170 pKa = 11.84ITGYY174 pKa = 7.6MTLQAGTRR182 pKa = 11.84VRR184 pKa = 11.84DD185 pKa = 3.59SDD187 pKa = 3.99PDD189 pKa = 3.54NDD191 pKa = 3.72KK192 pKa = 10.45PAPVLPAMLCFMNLNGNINSGGWAIYY218 pKa = 9.91DD219 pKa = 3.32QGDD222 pKa = 4.08RR223 pKa = 11.84IYY225 pKa = 11.49VDD227 pKa = 3.29TQYY230 pKa = 11.44PFYY233 pKa = 10.14TVTVNDD239 pKa = 2.78IRR241 pKa = 11.84LFVV244 pKa = 3.49
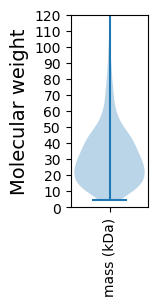
Molecular weight: 26.56 kDa
Isoelectric point according different methods:
Protein with the highest isoelectric point:
>tr|A0B9H1|A0B9H1_METTP Formylmethanofuran dehydrogenase subunit F OS=Methanothrix thermoacetophila (strain DSM 6194 / JCM 14653 / NBRC 101360 / PT) OX=349307 GN=Mthe_1575 PE=4 SV=1
MM1 pKa = 7.19SKK3 pKa = 10.63KK4 pKa = 9.55MKK6 pKa = 9.46PKK8 pKa = 10.44KK9 pKa = 9.68IRR11 pKa = 11.84LAKK14 pKa = 10.35ALRR17 pKa = 11.84QNQRR21 pKa = 11.84VPLWVIMKK29 pKa = 7.07TKK31 pKa = 10.18RR32 pKa = 11.84RR33 pKa = 11.84VVSHH37 pKa = 6.35PKK39 pKa = 8.22RR40 pKa = 11.84RR41 pKa = 11.84HH42 pKa = 3.68WRR44 pKa = 11.84RR45 pKa = 11.84SSLEE49 pKa = 3.69
MM1 pKa = 7.19SKK3 pKa = 10.63KK4 pKa = 9.55MKK6 pKa = 9.46PKK8 pKa = 10.44KK9 pKa = 9.68IRR11 pKa = 11.84LAKK14 pKa = 10.35ALRR17 pKa = 11.84QNQRR21 pKa = 11.84VPLWVIMKK29 pKa = 7.07TKK31 pKa = 10.18RR32 pKa = 11.84RR33 pKa = 11.84VVSHH37 pKa = 6.35PKK39 pKa = 8.22RR40 pKa = 11.84RR41 pKa = 11.84HH42 pKa = 3.68WRR44 pKa = 11.84RR45 pKa = 11.84SSLEE49 pKa = 3.69
Molecular weight: 6.08 kDa
Isoelectric point according different methods:
Peptides (in silico digests for buttom-up proteomics)
Below you can find in silico digests of the whole proteome with Trypsin, Chymotrypsin, Trypsin+LysC, LysN, ArgC proteases suitable for different mass spec machines.| Try ESI |
 |
|---|
| ChTry ESI |
|
|---|
| ArgC ESI |
|
|---|
| LysN ESI |
|
|---|
| TryLysC ESI |
|
|---|
| Try MALDI |
|
|---|
| ChTry MALDI |
|
|---|
| ArgC MALDI |
|
|---|
| LysN MALDI |
|
|---|
| TryLysC MALDI |
|
|---|
| Try LTQ |
|
|---|
| ChTry LTQ |
|
|---|
| ArgC LTQ |
|
|---|
| LysN LTQ |
|
|---|
| TryLysC LTQ |
|
|---|
| Try MSlow |
|
|---|
| ChTry MSlow |
|
|---|
| ArgC MSlow |
|
|---|
| LysN MSlow |
|
|---|
| TryLysC MSlow |
|
|---|
| Try MShigh |
|
|---|
| ChTry MShigh |
|
|---|
| ArgC MShigh |
|
|---|
| LysN MShigh |
|
|---|
| TryLysC MShigh |
|
|---|
General Statistics
Number of major isoforms |
Number of additional isoforms |
Number of all proteins |
Number of amino acids |
Min. Seq. Length |
Max. Seq. Length |
Avg. Seq. Length |
Avg. Mol. Weight |
|---|---|---|---|---|---|---|---|
0 |
508086 |
41 |
2713 |
303.7 |
33.67 |
Amino acid frequency
Ala |
Cys |
Asp |
Glu |
Phe |
Gly |
His |
Ile |
Lys |
Leu |
|---|---|---|---|---|---|---|---|---|---|
8.308 ± 0.059 | 1.338 ± 0.024 |
5.817 ± 0.039 | 7.303 ± 0.067 |
3.286 ± 0.036 | 7.94 ± 0.055 |
1.842 ± 0.027 | 7.317 ± 0.047 |
4.022 ± 0.049 | 9.525 ± 0.071 |
Met |
Asn |
Gln |
Pro |
Arg |
Ser |
Thr |
Val |
Trp |
Tyr |
|---|---|---|---|---|---|---|---|---|---|
3.081 ± 0.032 | 2.921 ± 0.04 |
4.468 ± 0.033 | 2.119 ± 0.027 |
7.476 ± 0.064 | 6.702 ± 0.069 |
4.574 ± 0.064 | 7.837 ± 0.058 |
1.038 ± 0.027 | 3.087 ± 0.043 |
Most of the basic statistics you can see at this page can be downloaded from this CSV file
See this proteome in:

Proteome-pI is available under Creative Commons Attribution-NoDerivs license, for more details see here
| Reference: Kozlowski LP. Proteome-pI 2.0: Proteome Isoelectric Point Database Update. Nucleic Acids Res. 2021, doi: 10.1093/nar/gkab944 | Contact: Lukasz P. Kozlowski |