Bacillus sp. AFS040349
Taxonomy: cellular organisms; Bacteria; Terrabacteria group; Firmicutes; Bacilli; Bacillales; Bacillaceae; Bacillus; unclassified Bacillus (in: Bacteria)
Average proteome isoelectric point is 6.28
Get precalculated fractions of proteins

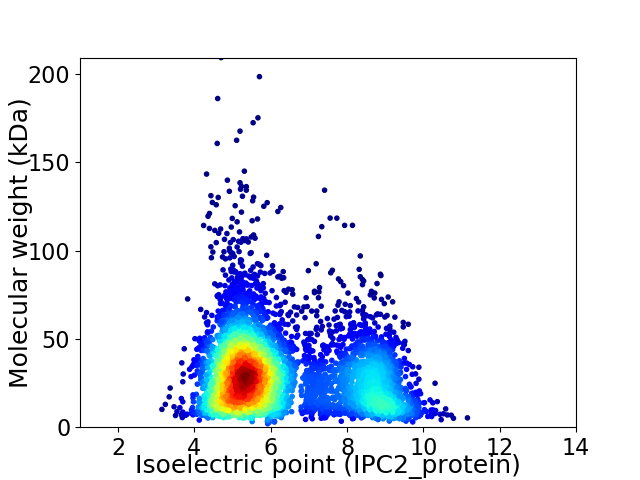
Virtual 2D-PAGE plot for 5011 proteins (isoelectric point calculated using IPC2_protein)
Get csv file with sequences according to given criteria:
* You can choose from 21 different methods for calculating isoelectric point
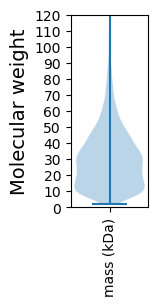
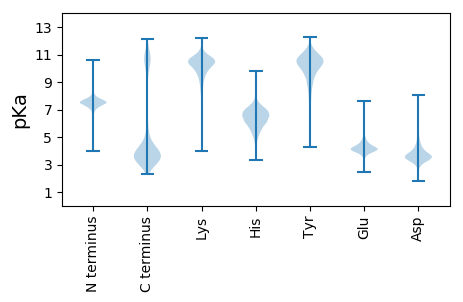
Summary statistics related to proteome-wise predictions


Protein with the lowest isoelectric point:
>tr|A0A2C1KAW4|A0A2C1KAW4_9BACI G-D-S-L family lipolytic protein OS=Bacillus sp. AFS040349 OX=2033502 GN=COD11_14085 PE=4 SV=1
MM1 pKa = 7.37YY2 pKa = 10.45LPIIEE7 pKa = 4.97CYY9 pKa = 9.75MIIFLFIEE17 pKa = 4.47SYY19 pKa = 10.22VIQRR23 pKa = 11.84VAEE26 pKa = 4.12LEE28 pKa = 3.88MDD30 pKa = 3.44VTLGYY35 pKa = 10.85FEE37 pKa = 4.39MVEE40 pKa = 4.04NLEE43 pKa = 4.24VDD45 pKa = 3.69CSSKK49 pKa = 10.82QEE51 pKa = 4.16EE52 pKa = 4.33FTLLAFSEE60 pKa = 4.71NEE62 pKa = 3.96DD63 pKa = 3.68CSTSEE68 pKa = 3.72VSGPAIVPTISVLDD82 pKa = 4.37DD83 pKa = 3.85GALEE87 pKa = 4.27LMNSLEE93 pKa = 4.09QEE95 pKa = 4.26VMEE98 pKa = 5.29LNQGDD103 pKa = 4.13NLDD106 pKa = 3.91NQEE109 pKa = 4.34DD110 pKa = 5.72YY111 pKa = 11.31YY112 pKa = 11.53VYY114 pKa = 11.03SDD116 pKa = 4.13ADD118 pKa = 4.07CPPEE122 pKa = 5.89LDD124 pKa = 3.69GQNDD128 pKa = 3.15EE129 pKa = 4.5SQWVKK134 pKa = 10.79LNSVEE139 pKa = 4.33EE140 pKa = 4.24EE141 pKa = 3.68EE142 pKa = 5.82DD143 pKa = 3.82YY144 pKa = 11.74LSMSDD149 pKa = 4.71LNGEE153 pKa = 4.54NSDD156 pKa = 3.47QQLNIDD162 pKa = 4.46SYY164 pKa = 11.32SQFSTSKK171 pKa = 10.38ISDD174 pKa = 3.4NMEE177 pKa = 4.15GLQQWTVKK185 pKa = 9.98VVGMEE190 pKa = 3.72DD191 pKa = 3.64AYY193 pKa = 10.3IHH195 pKa = 6.49VSDD198 pKa = 5.21GQRR201 pKa = 11.84IWLNVGIEE209 pKa = 4.09KK210 pKa = 10.45ARR212 pKa = 11.84KK213 pKa = 7.44ITNNDD218 pKa = 2.46ILAIDD223 pKa = 3.51VMKK226 pKa = 10.72NGKK229 pKa = 7.91EE230 pKa = 4.02VEE232 pKa = 4.05VLRR235 pKa = 11.84IIKK238 pKa = 10.24LEE240 pKa = 4.06SGVNEE245 pKa = 5.08DD246 pKa = 3.69YY247 pKa = 11.18LIPDD251 pKa = 3.56EE252 pKa = 4.31EE253 pKa = 5.6SYY255 pKa = 11.18FGVEE259 pKa = 4.09DD260 pKa = 3.91SKK262 pKa = 11.99VAMM265 pKa = 4.85
MM1 pKa = 7.37YY2 pKa = 10.45LPIIEE7 pKa = 4.97CYY9 pKa = 9.75MIIFLFIEE17 pKa = 4.47SYY19 pKa = 10.22VIQRR23 pKa = 11.84VAEE26 pKa = 4.12LEE28 pKa = 3.88MDD30 pKa = 3.44VTLGYY35 pKa = 10.85FEE37 pKa = 4.39MVEE40 pKa = 4.04NLEE43 pKa = 4.24VDD45 pKa = 3.69CSSKK49 pKa = 10.82QEE51 pKa = 4.16EE52 pKa = 4.33FTLLAFSEE60 pKa = 4.71NEE62 pKa = 3.96DD63 pKa = 3.68CSTSEE68 pKa = 3.72VSGPAIVPTISVLDD82 pKa = 4.37DD83 pKa = 3.85GALEE87 pKa = 4.27LMNSLEE93 pKa = 4.09QEE95 pKa = 4.26VMEE98 pKa = 5.29LNQGDD103 pKa = 4.13NLDD106 pKa = 3.91NQEE109 pKa = 4.34DD110 pKa = 5.72YY111 pKa = 11.31YY112 pKa = 11.53VYY114 pKa = 11.03SDD116 pKa = 4.13ADD118 pKa = 4.07CPPEE122 pKa = 5.89LDD124 pKa = 3.69GQNDD128 pKa = 3.15EE129 pKa = 4.5SQWVKK134 pKa = 10.79LNSVEE139 pKa = 4.33EE140 pKa = 4.24EE141 pKa = 3.68EE142 pKa = 5.82DD143 pKa = 3.82YY144 pKa = 11.74LSMSDD149 pKa = 4.71LNGEE153 pKa = 4.54NSDD156 pKa = 3.47QQLNIDD162 pKa = 4.46SYY164 pKa = 11.32SQFSTSKK171 pKa = 10.38ISDD174 pKa = 3.4NMEE177 pKa = 4.15GLQQWTVKK185 pKa = 9.98VVGMEE190 pKa = 3.72DD191 pKa = 3.64AYY193 pKa = 10.3IHH195 pKa = 6.49VSDD198 pKa = 5.21GQRR201 pKa = 11.84IWLNVGIEE209 pKa = 4.09KK210 pKa = 10.45ARR212 pKa = 11.84KK213 pKa = 7.44ITNNDD218 pKa = 2.46ILAIDD223 pKa = 3.51VMKK226 pKa = 10.72NGKK229 pKa = 7.91EE230 pKa = 4.02VEE232 pKa = 4.05VLRR235 pKa = 11.84IIKK238 pKa = 10.24LEE240 pKa = 4.06SGVNEE245 pKa = 5.08DD246 pKa = 3.69YY247 pKa = 11.18LIPDD251 pKa = 3.56EE252 pKa = 4.31EE253 pKa = 5.6SYY255 pKa = 11.18FGVEE259 pKa = 4.09DD260 pKa = 3.91SKK262 pKa = 11.99VAMM265 pKa = 4.85
Molecular weight: 30.13 kDa
Isoelectric point according different methods:
Protein with the highest isoelectric point:
>tr|A0A2C1KAB3|A0A2C1KAB3_9BACI MarR family transcriptional regulator OS=Bacillus sp. AFS040349 OX=2033502 GN=COD11_15180 PE=4 SV=1
MM1 pKa = 7.35KK2 pKa = 9.42RR3 pKa = 11.84TYY5 pKa = 10.34QPNKK9 pKa = 8.21RR10 pKa = 11.84KK11 pKa = 9.62RR12 pKa = 11.84SKK14 pKa = 9.59VHH16 pKa = 5.83GFRR19 pKa = 11.84SRR21 pKa = 11.84MSTANGRR28 pKa = 11.84KK29 pKa = 8.48VLARR33 pKa = 11.84RR34 pKa = 11.84RR35 pKa = 11.84RR36 pKa = 11.84RR37 pKa = 11.84GRR39 pKa = 11.84KK40 pKa = 8.94VLSAA44 pKa = 4.11
MM1 pKa = 7.35KK2 pKa = 9.42RR3 pKa = 11.84TYY5 pKa = 10.34QPNKK9 pKa = 8.21RR10 pKa = 11.84KK11 pKa = 9.62RR12 pKa = 11.84SKK14 pKa = 9.59VHH16 pKa = 5.83GFRR19 pKa = 11.84SRR21 pKa = 11.84MSTANGRR28 pKa = 11.84KK29 pKa = 8.48VLARR33 pKa = 11.84RR34 pKa = 11.84RR35 pKa = 11.84RR36 pKa = 11.84RR37 pKa = 11.84GRR39 pKa = 11.84KK40 pKa = 8.94VLSAA44 pKa = 4.11
Molecular weight: 5.28 kDa
Isoelectric point according different methods:
Peptides (in silico digests for buttom-up proteomics)
Below you can find in silico digests of the whole proteome with Trypsin, Chymotrypsin, Trypsin+LysC, LysN, ArgC proteases suitable for different mass spec machines.| Try ESI |
 |
|---|
| ChTry ESI |
 |
|---|
| ArgC ESI |
 |
|---|
| LysN ESI |
 |
|---|
| TryLysC ESI |
 |
|---|
| Try MALDI |
 |
|---|
| ChTry MALDI |
 |
|---|
| ArgC MALDI |
 |
|---|
| LysN MALDI |
 |
|---|
| TryLysC MALDI |
 |
|---|
| Try LTQ |
 |
|---|
| ChTry LTQ |
 |
|---|
| ArgC LTQ |
 |
|---|
| LysN LTQ |
 |
|---|
| TryLysC LTQ |
 |
|---|
| Try MSlow |
 |
|---|
| ChTry MSlow |
 |
|---|
| ArgC MSlow |
 |
|---|
| LysN MSlow |
 |
|---|
| TryLysC MSlow |
 |
|---|
| Try MShigh |
 |
|---|
| ChTry MShigh |
 |
|---|
| ArgC MShigh |
 |
|---|
| LysN MShigh |
 |
|---|
| TryLysC MShigh |
 |
|---|
General Statistics
Number of major isoforms |
Number of additional isoforms |
Number of all proteins |
Number of amino acids |
Min. Seq. Length |
Max. Seq. Length |
Avg. Seq. Length |
Avg. Mol. Weight |
|---|---|---|---|---|---|---|---|
0 |
1419903 |
18 |
1878 |
283.4 |
31.95 |
Amino acid frequency
Ala |
Cys |
Asp |
Glu |
Phe |
Gly |
His |
Ile |
Lys |
Leu |
|---|---|---|---|---|---|---|---|---|---|
6.273 ± 0.035 | 0.736 ± 0.011 |
5.087 ± 0.028 | 7.711 ± 0.04 |
4.595 ± 0.027 | 6.511 ± 0.034 |
2.092 ± 0.017 | 8.119 ± 0.045 |
7.271 ± 0.031 | 9.806 ± 0.041 |
Met |
Asn |
Gln |
Pro |
Arg |
Ser |
Thr |
Val |
Trp |
Tyr |
|---|---|---|---|---|---|---|---|---|---|
2.658 ± 0.017 | 4.777 ± 0.028 |
3.403 ± 0.022 | 3.828 ± 0.029 |
3.756 ± 0.028 | 6.381 ± 0.029 |
5.485 ± 0.024 | 6.909 ± 0.03 |
0.971 ± 0.013 | 3.63 ± 0.023 |
Most of the basic statistics you can see at this page can be downloaded from this CSV file
Proteome-pI is available under Creative Commons Attribution-NoDerivs license, for more details see here
| Reference: Kozlowski LP. Proteome-pI 2.0: Proteome Isoelectric Point Database Update. Nucleic Acids Res. 2021, doi: 10.1093/nar/gkab944 | Contact: Lukasz P. Kozlowski |
