Marinilabiliaceae bacterium JC017
Taxonomy: cellular organisms; Bacteria; FCB group; Bacteroidetes/Chlorobi group; Bacteroidetes; Bacteroidia; Marinilabiliales; Marinilabiliaceae; unclassified Marinilabiliaceae
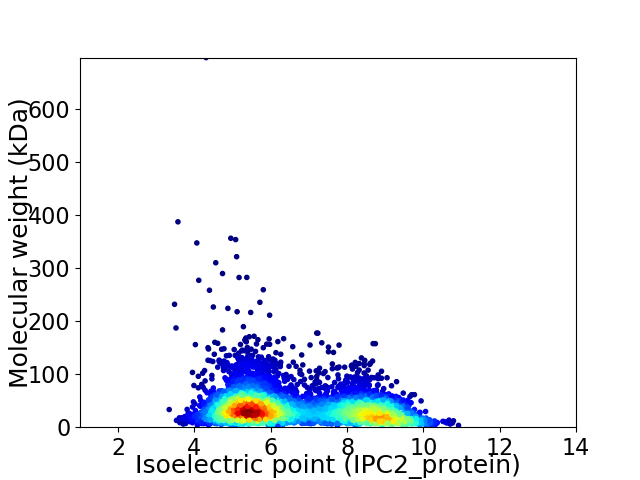
Average proteome isoelectric point is 6.69
Get precalculated fractions of proteins

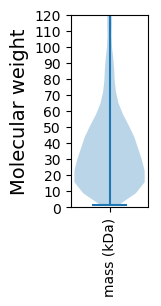
Virtual 2D-PAGE plot for 4913 proteins (isoelectric point calculated using IPC2_protein)
Get csv file with sequences according to given criteria:
* You can choose from 21 different methods for calculating isoelectric point
Summary statistics related to proteome-wise predictions


Protein with the lowest isoelectric point:
>tr|A0A4Q8RMT9|A0A4Q8RMT9_9BACT 4-hydroxy-tetrahydrodipicolinate synthase OS=Marinilabiliaceae bacterium JC017 OX=2234116 GN=dapA PE=3 SV=1
MM1 pKa = 7.5KK2 pKa = 10.2ALKK5 pKa = 10.21FGLLIALVGLFTVSCDD21 pKa = 4.4DD22 pKa = 5.03DD23 pKa = 6.28DD24 pKa = 6.26DD25 pKa = 5.12YY26 pKa = 12.23SLGKK30 pKa = 10.07FIISMGTIEE39 pKa = 5.19GDD41 pKa = 2.94QDD43 pKa = 3.89SYY45 pKa = 11.79IIVTDD50 pKa = 3.17SGDD53 pKa = 3.56RR54 pKa = 11.84LFPSASNVPNYY65 pKa = 9.71PVEE68 pKa = 5.33DD69 pKa = 4.13DD70 pKa = 3.2MRR72 pKa = 11.84VWVNYY77 pKa = 8.8TILGDD82 pKa = 3.61ATDD85 pKa = 4.98NEE87 pKa = 4.44TLDD90 pKa = 3.98YY91 pKa = 10.39YY92 pKa = 11.49VKK94 pKa = 10.67INDD97 pKa = 4.06LSDD100 pKa = 3.57VLTKK104 pKa = 10.6DD105 pKa = 3.05IFQLTDD111 pKa = 3.06ATRR114 pKa = 11.84DD115 pKa = 3.67SIGNDD120 pKa = 3.17PVSISDD126 pKa = 3.12YY127 pKa = 10.34WIARR131 pKa = 11.84DD132 pKa = 3.49YY133 pKa = 11.72LNIGFYY139 pKa = 10.82YY140 pKa = 10.61GGGPGYY146 pKa = 9.58IHH148 pKa = 7.19YY149 pKa = 10.39INLVNDD155 pKa = 3.54EE156 pKa = 4.82NDD158 pKa = 3.53PEE160 pKa = 4.54TEE162 pKa = 4.03DD163 pKa = 3.89GMLILEE169 pKa = 4.9LKK171 pKa = 9.87HH172 pKa = 6.36NKK174 pKa = 9.67NNDD177 pKa = 3.26PYY179 pKa = 11.39NYY181 pKa = 9.96RR182 pKa = 11.84INNWASFDD190 pKa = 3.83LLSIQEE196 pKa = 4.07EE197 pKa = 4.73GKK199 pKa = 10.71DD200 pKa = 3.38EE201 pKa = 4.24VTFLLRR207 pKa = 11.84SIGPSGEE214 pKa = 4.08YY215 pKa = 10.19EE216 pKa = 3.99FEE218 pKa = 4.31KK219 pKa = 10.8EE220 pKa = 3.81VTYY223 pKa = 10.5KK224 pKa = 10.99YY225 pKa = 11.12GLDD228 pKa = 3.46LL229 pKa = 4.98
MM1 pKa = 7.5KK2 pKa = 10.2ALKK5 pKa = 10.21FGLLIALVGLFTVSCDD21 pKa = 4.4DD22 pKa = 5.03DD23 pKa = 6.28DD24 pKa = 6.26DD25 pKa = 5.12YY26 pKa = 12.23SLGKK30 pKa = 10.07FIISMGTIEE39 pKa = 5.19GDD41 pKa = 2.94QDD43 pKa = 3.89SYY45 pKa = 11.79IIVTDD50 pKa = 3.17SGDD53 pKa = 3.56RR54 pKa = 11.84LFPSASNVPNYY65 pKa = 9.71PVEE68 pKa = 5.33DD69 pKa = 4.13DD70 pKa = 3.2MRR72 pKa = 11.84VWVNYY77 pKa = 8.8TILGDD82 pKa = 3.61ATDD85 pKa = 4.98NEE87 pKa = 4.44TLDD90 pKa = 3.98YY91 pKa = 10.39YY92 pKa = 11.49VKK94 pKa = 10.67INDD97 pKa = 4.06LSDD100 pKa = 3.57VLTKK104 pKa = 10.6DD105 pKa = 3.05IFQLTDD111 pKa = 3.06ATRR114 pKa = 11.84DD115 pKa = 3.67SIGNDD120 pKa = 3.17PVSISDD126 pKa = 3.12YY127 pKa = 10.34WIARR131 pKa = 11.84DD132 pKa = 3.49YY133 pKa = 11.72LNIGFYY139 pKa = 10.82YY140 pKa = 10.61GGGPGYY146 pKa = 9.58IHH148 pKa = 7.19YY149 pKa = 10.39INLVNDD155 pKa = 3.54EE156 pKa = 4.82NDD158 pKa = 3.53PEE160 pKa = 4.54TEE162 pKa = 4.03DD163 pKa = 3.89GMLILEE169 pKa = 4.9LKK171 pKa = 9.87HH172 pKa = 6.36NKK174 pKa = 9.67NNDD177 pKa = 3.26PYY179 pKa = 11.39NYY181 pKa = 9.96RR182 pKa = 11.84INNWASFDD190 pKa = 3.83LLSIQEE196 pKa = 4.07EE197 pKa = 4.73GKK199 pKa = 10.71DD200 pKa = 3.38EE201 pKa = 4.24VTFLLRR207 pKa = 11.84SIGPSGEE214 pKa = 4.08YY215 pKa = 10.19EE216 pKa = 3.99FEE218 pKa = 4.31KK219 pKa = 10.8EE220 pKa = 3.81VTYY223 pKa = 10.5KK224 pKa = 10.99YY225 pKa = 11.12GLDD228 pKa = 3.46LL229 pKa = 4.98
Molecular weight: 26.01 kDa
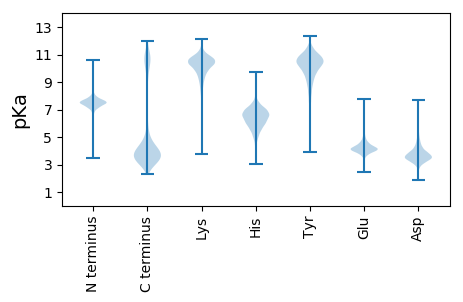
Isoelectric point according different methods:
Protein with the highest isoelectric point:
>tr|A0A4Q8RRE7|A0A4Q8RRE7_9BACT Acetate kinase OS=Marinilabiliaceae bacterium JC017 OX=2234116 GN=ackA PE=3 SV=1
MM1 pKa = 7.31VILPRR6 pKa = 11.84GMVILPRR13 pKa = 11.84GMVILPRR20 pKa = 11.84GMVILPRR27 pKa = 11.84GMVILPRR34 pKa = 11.84GMVILPRR41 pKa = 11.84GMVILPRR48 pKa = 11.84GMVILPRR55 pKa = 11.84GTVILPRR62 pKa = 11.84GTVILPRR69 pKa = 11.84GTVILPRR76 pKa = 11.84CMDD79 pKa = 3.85ILPRR83 pKa = 11.84GMIILPRR90 pKa = 11.84GMNVLPNGIIILPKK104 pKa = 10.51NFIIRR109 pKa = 3.63
MM1 pKa = 7.31VILPRR6 pKa = 11.84GMVILPRR13 pKa = 11.84GMVILPRR20 pKa = 11.84GMVILPRR27 pKa = 11.84GMVILPRR34 pKa = 11.84GMVILPRR41 pKa = 11.84GMVILPRR48 pKa = 11.84GMVILPRR55 pKa = 11.84GTVILPRR62 pKa = 11.84GTVILPRR69 pKa = 11.84GTVILPRR76 pKa = 11.84CMDD79 pKa = 3.85ILPRR83 pKa = 11.84GMIILPRR90 pKa = 11.84GMNVLPNGIIILPKK104 pKa = 10.51NFIIRR109 pKa = 3.63
Molecular weight: 12.02 kDa
Isoelectric point according different methods:
Peptides (in silico digests for buttom-up proteomics)
Below you can find in silico digests of the whole proteome with Trypsin, Chymotrypsin, Trypsin+LysC, LysN, ArgC proteases suitable for different mass spec machines.| Try ESI |
 |
|---|
| ChTry ESI |
 |
|---|
| ArgC ESI |
 |
|---|
| LysN ESI |
 |
|---|
| TryLysC ESI |
 |
|---|
| Try MALDI |
 |
|---|
| ChTry MALDI |
 |
|---|
| ArgC MALDI |
 |
|---|
| LysN MALDI |
 |
|---|
| TryLysC MALDI |
 |
|---|
| Try LTQ |
 |
|---|
| ChTry LTQ |
 |
|---|
| ArgC LTQ |
 |
|---|
| LysN LTQ |
 |
|---|
| TryLysC LTQ |
 |
|---|
| Try MSlow |
 |
|---|
| ChTry MSlow |
 |
|---|
| ArgC MSlow |
 |
|---|
| LysN MSlow |
 |
|---|
| TryLysC MSlow |
 |
|---|
| Try MShigh |
 |
|---|
| ChTry MShigh |
 |
|---|
| ArgC MShigh |
 |
|---|
| LysN MShigh |
 |
|---|
| TryLysC MShigh |
 |
|---|
General Statistics
Number of major isoforms |
Number of additional isoforms |
Number of all proteins |
Number of amino acids |
Min. Seq. Length |
Max. Seq. Length |
Avg. Seq. Length |
Avg. Mol. Weight |
|---|---|---|---|---|---|---|---|
0 |
1713457 |
14 |
6519 |
348.8 |
39.44 |
Amino acid frequency
Ala |
Cys |
Asp |
Glu |
Phe |
Gly |
His |
Ile |
Lys |
Leu |
|---|---|---|---|---|---|---|---|---|---|
6.318 ± 0.033 | 0.994 ± 0.012 |
5.52 ± 0.033 | 6.566 ± 0.031 |
4.988 ± 0.032 | 6.666 ± 0.038 |
2.033 ± 0.019 | 7.37 ± 0.034 |
7.221 ± 0.038 | 9.347 ± 0.042 |
Met |
Asn |
Gln |
Pro |
Arg |
Ser |
Thr |
Val |
Trp |
Tyr |
|---|---|---|---|---|---|---|---|---|---|
2.446 ± 0.018 | 5.583 ± 0.032 |
3.65 ± 0.017 | 3.602 ± 0.02 |
4.121 ± 0.026 | 6.342 ± 0.026 |
5.354 ± 0.038 | 6.445 ± 0.036 |
1.23 ± 0.015 | 4.162 ± 0.025 |
Most of the basic statistics you can see at this page can be downloaded from this CSV file
Proteome-pI is available under Creative Commons Attribution-NoDerivs license, for more details see here
| Reference: Kozlowski LP. Proteome-pI 2.0: Proteome Isoelectric Point Database Update. Nucleic Acids Res. 2021, doi: 10.1093/nar/gkab944 | Contact: Lukasz P. Kozlowski |
