Streptomyces laurentii
Taxonomy: cellular organisms; Bacteria;
Average proteome isoelectric point is 6.52
Get precalculated fractions of proteins
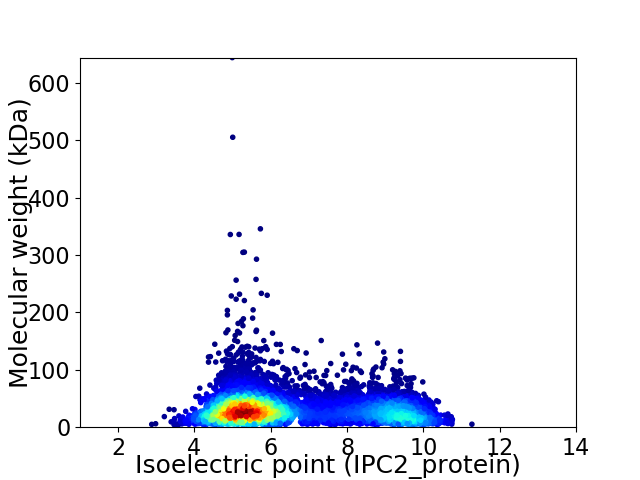
Virtual 2D-PAGE plot for 7440 proteins (isoelectric point calculated using IPC2_protein)
Get csv file with sequences according to given criteria:
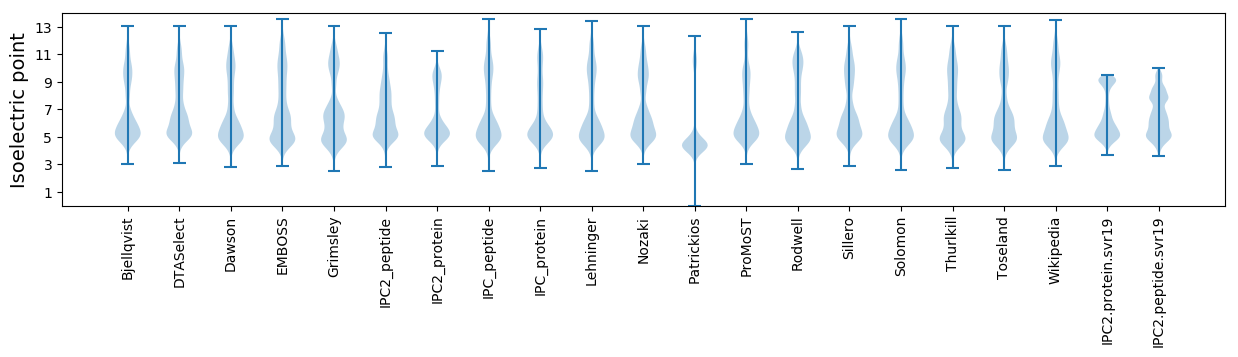
* You can choose from 21 different methods for calculating isoelectric point
Summary statistics related to proteome-wise predictions
Protein with the lowest isoelectric point:
>tr|A0A160NW43|A0A160NW43_STRLU Alkyl hydroperoxide reductase OS=Streptomyces laurentii OX=39478 GN=SLA_1990 PE=4 SV=1
MM1 pKa = 8.08DD2 pKa = 5.69APTDD6 pKa = 3.76SDD8 pKa = 3.82VSGDD12 pKa = 3.59ARR14 pKa = 11.84VEE16 pKa = 3.83ALSPDD21 pKa = 3.51RR22 pKa = 11.84TVVYY26 pKa = 10.42YY27 pKa = 10.72DD28 pKa = 3.51AADD31 pKa = 3.87EE32 pKa = 4.37VLHH35 pKa = 5.92PTLVLGFGEE44 pKa = 4.19LCIVKK49 pKa = 9.98VSNDD53 pKa = 3.48DD54 pKa = 3.16DD55 pKa = 3.95WYY57 pKa = 10.1MGSRR61 pKa = 11.84NDD63 pKa = 5.1DD64 pKa = 3.05GSAICWSIYY73 pKa = 10.21ADD75 pKa = 3.7LYY77 pKa = 10.0EE78 pKa = 4.61ALRR81 pKa = 11.84GLL83 pKa = 4.04
MM1 pKa = 8.08DD2 pKa = 5.69APTDD6 pKa = 3.76SDD8 pKa = 3.82VSGDD12 pKa = 3.59ARR14 pKa = 11.84VEE16 pKa = 3.83ALSPDD21 pKa = 3.51RR22 pKa = 11.84TVVYY26 pKa = 10.42YY27 pKa = 10.72DD28 pKa = 3.51AADD31 pKa = 3.87EE32 pKa = 4.37VLHH35 pKa = 5.92PTLVLGFGEE44 pKa = 4.19LCIVKK49 pKa = 9.98VSNDD53 pKa = 3.48DD54 pKa = 3.16DD55 pKa = 3.95WYY57 pKa = 10.1MGSRR61 pKa = 11.84NDD63 pKa = 5.1DD64 pKa = 3.05GSAICWSIYY73 pKa = 10.21ADD75 pKa = 3.7LYY77 pKa = 10.0EE78 pKa = 4.61ALRR81 pKa = 11.84GLL83 pKa = 4.04
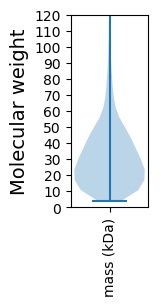
Molecular weight: 9.11 kDa
Isoelectric point according different methods:
Protein with the highest isoelectric point:
>tr|A0A169NSJ5|A0A169NSJ5_STRLU Cold shock protein scoF OS=Streptomyces laurentii OX=39478 GN=SLA_4364 PE=4 SV=1
MM1 pKa = 7.69SKK3 pKa = 9.0RR4 pKa = 11.84TFQPNNRR11 pKa = 11.84RR12 pKa = 11.84RR13 pKa = 11.84AKK15 pKa = 8.7THH17 pKa = 5.15GFRR20 pKa = 11.84LRR22 pKa = 11.84MRR24 pKa = 11.84TRR26 pKa = 11.84AGRR29 pKa = 11.84AILANRR35 pKa = 11.84RR36 pKa = 11.84AKK38 pKa = 10.46GRR40 pKa = 11.84ASLSAA45 pKa = 3.83
MM1 pKa = 7.69SKK3 pKa = 9.0RR4 pKa = 11.84TFQPNNRR11 pKa = 11.84RR12 pKa = 11.84RR13 pKa = 11.84AKK15 pKa = 8.7THH17 pKa = 5.15GFRR20 pKa = 11.84LRR22 pKa = 11.84MRR24 pKa = 11.84TRR26 pKa = 11.84AGRR29 pKa = 11.84AILANRR35 pKa = 11.84RR36 pKa = 11.84AKK38 pKa = 10.46GRR40 pKa = 11.84ASLSAA45 pKa = 3.83
Molecular weight: 5.22 kDa
Isoelectric point according different methods:
Peptides (in silico digests for buttom-up proteomics)
Below you can find in silico digests of the whole proteome with Trypsin, Chymotrypsin, Trypsin+LysC, LysN, ArgC proteases suitable for different mass spec machines.| Try ESI |
 |
|---|
| ChTry ESI |
|
|---|
| ArgC ESI |
|
|---|
| LysN ESI |
|
|---|
| TryLysC ESI |
|
|---|
| Try MALDI |
|
|---|
| ChTry MALDI |
|
|---|
| ArgC MALDI |
|
|---|
| LysN MALDI |
|
|---|
| TryLysC MALDI |
|
|---|
| Try LTQ |
|
|---|
| ChTry LTQ |
|
|---|
| ArgC LTQ |
|
|---|
| LysN LTQ |
|
|---|
| TryLysC LTQ |
|
|---|
| Try MSlow |
|
|---|
| ChTry MSlow |
|
|---|
| ArgC MSlow |
|
|---|
| LysN MSlow |
|
|---|
| TryLysC MSlow |
|
|---|
| Try MShigh |
|
|---|
| ChTry MShigh |
|
|---|
| ArgC MShigh |
|
|---|
| LysN MShigh |
|
|---|
| TryLysC MShigh |
|
|---|
General Statistics
Number of major isoforms |
Number of additional isoforms |
Number of all proteins |
Number of amino acids |
Min. Seq. Length |
Max. Seq. Length |
Avg. Seq. Length |
Avg. Mol. Weight |
|---|---|---|---|---|---|---|---|
0 |
2333776 |
39 |
6066 |
313.7 |
33.46 |
Amino acid frequency
Ala |
Cys |
Asp |
Glu |
Phe |
Gly |
His |
Ile |
Lys |
Leu |
|---|---|---|---|---|---|---|---|---|---|
14.104 ± 0.05 | 0.789 ± 0.008 |
5.98 ± 0.024 | 5.607 ± 0.03 |
2.648 ± 0.016 | 9.694 ± 0.028 |
2.236 ± 0.013 | 2.981 ± 0.02 |
2.089 ± 0.026 | 10.207 ± 0.038 |
Met |
Asn |
Gln |
Pro |
Arg |
Ser |
Thr |
Val |
Trp |
Tyr |
|---|---|---|---|---|---|---|---|---|---|
1.71 ± 0.012 | 1.651 ± 0.016 |
6.48 ± 0.029 | 2.55 ± 0.016 |
8.276 ± 0.033 | 4.854 ± 0.022 |
6.306 ± 0.033 | 8.311 ± 0.026 |
1.493 ± 0.013 | 2.034 ± 0.015 |
Most of the basic statistics you can see at this page can be downloaded from this CSV file
See this proteome in:

Proteome-pI is available under Creative Commons Attribution-NoDerivs license, for more details see here
| Reference: Kozlowski LP. Proteome-pI 2.0: Proteome Isoelectric Point Database Update. Nucleic Acids Res. 2021, doi: 10.1093/nar/gkab944 | Contact: Lukasz P. Kozlowski |