Acetobacter aceti NBRC 14818
Taxonomy: cellular organisms; Bacteria; Proteobacteria; Alphaproteobacteria; Rhodospirillales; Acetobacteraceae; Acetobacter; Acetobacter subgen. Acetobacter; Acetobacter aceti
Average proteome isoelectric point is 6.51
Get precalculated fractions of proteins

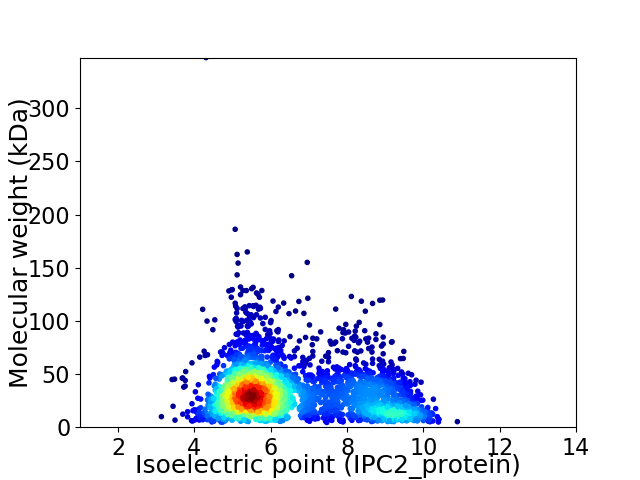
Virtual 2D-PAGE plot for 3146 proteins (isoelectric point calculated using IPC2_protein)
Get csv file with sequences according to given criteria:
* You can choose from 21 different methods for calculating isoelectric point
Summary statistics related to proteome-wise predictions


Protein with the lowest isoelectric point:
>tr|A0A0D6MUB1|A0A0D6MUB1_ACEAC Orotate phosphoribosyltransferase OS=Acetobacter aceti NBRC 14818 OX=887700 GN=pyrE PE=3 SV=1
MM1 pKa = 7.64SNLIADD7 pKa = 3.95IWNIGRR13 pKa = 11.84NIEE16 pKa = 3.97TSLIQSADD24 pKa = 3.47DD25 pKa = 3.73FLNDD29 pKa = 3.69TGINQIWSSLAALPSNILDD48 pKa = 3.33NTTPNNLLTFLNDD61 pKa = 3.21DD62 pKa = 3.67TAIPVPTHH70 pKa = 5.92QNLNQTPTVSQFLNAANTEE89 pKa = 4.16YY90 pKa = 11.42ALTGTPNGMSPFLVNGQQLAVIDD113 pKa = 4.35EE114 pKa = 4.44ASGMSAKK121 pKa = 10.15VWVTDD126 pKa = 3.32NDD128 pKa = 3.5QVIIAFQGTGGGFNAITNPAAVATGFLSDD157 pKa = 3.59VQIWNQSVSQAQKK170 pKa = 10.07DD171 pKa = 3.88ALSFTHH177 pKa = 5.96YY178 pKa = 10.49VVDD181 pKa = 3.93MAQKK185 pKa = 10.53QGIDD189 pKa = 3.36TNNIFVTGHH198 pKa = 5.54SLGGIEE204 pKa = 4.51ASYY207 pKa = 10.83VAQQTGLGGIAFEE220 pKa = 4.26PTGIPSSTTAKK231 pKa = 10.67GDD233 pKa = 3.42GSNFASVVTYY243 pKa = 10.23GDD245 pKa = 3.48PVGEE249 pKa = 4.29YY250 pKa = 10.97ANDD253 pKa = 3.72TMPGSSFVTSMPVGAAGDD271 pKa = 3.95FNHH274 pKa = 6.37YY275 pKa = 9.47GQVVMLGNPADD286 pKa = 4.1NAPLAAAVSNWNASSIGNVGEE307 pKa = 4.31LLSAASFAGYY317 pKa = 9.74HH318 pKa = 6.15LPGTQAADD326 pKa = 3.35MGITMTPYY334 pKa = 10.55VSLGDD339 pKa = 3.6TTHH342 pKa = 5.81YY343 pKa = 10.72QSGAVFNVGNDD354 pKa = 3.61SIAQLLTDD362 pKa = 3.62NADD365 pKa = 3.85RR366 pKa = 11.84TSSLASS372 pKa = 3.36
MM1 pKa = 7.64SNLIADD7 pKa = 3.95IWNIGRR13 pKa = 11.84NIEE16 pKa = 3.97TSLIQSADD24 pKa = 3.47DD25 pKa = 3.73FLNDD29 pKa = 3.69TGINQIWSSLAALPSNILDD48 pKa = 3.33NTTPNNLLTFLNDD61 pKa = 3.21DD62 pKa = 3.67TAIPVPTHH70 pKa = 5.92QNLNQTPTVSQFLNAANTEE89 pKa = 4.16YY90 pKa = 11.42ALTGTPNGMSPFLVNGQQLAVIDD113 pKa = 4.35EE114 pKa = 4.44ASGMSAKK121 pKa = 10.15VWVTDD126 pKa = 3.32NDD128 pKa = 3.5QVIIAFQGTGGGFNAITNPAAVATGFLSDD157 pKa = 3.59VQIWNQSVSQAQKK170 pKa = 10.07DD171 pKa = 3.88ALSFTHH177 pKa = 5.96YY178 pKa = 10.49VVDD181 pKa = 3.93MAQKK185 pKa = 10.53QGIDD189 pKa = 3.36TNNIFVTGHH198 pKa = 5.54SLGGIEE204 pKa = 4.51ASYY207 pKa = 10.83VAQQTGLGGIAFEE220 pKa = 4.26PTGIPSSTTAKK231 pKa = 10.67GDD233 pKa = 3.42GSNFASVVTYY243 pKa = 10.23GDD245 pKa = 3.48PVGEE249 pKa = 4.29YY250 pKa = 10.97ANDD253 pKa = 3.72TMPGSSFVTSMPVGAAGDD271 pKa = 3.95FNHH274 pKa = 6.37YY275 pKa = 9.47GQVVMLGNPADD286 pKa = 4.1NAPLAAAVSNWNASSIGNVGEE307 pKa = 4.31LLSAASFAGYY317 pKa = 9.74HH318 pKa = 6.15LPGTQAADD326 pKa = 3.35MGITMTPYY334 pKa = 10.55VSLGDD339 pKa = 3.6TTHH342 pKa = 5.81YY343 pKa = 10.72QSGAVFNVGNDD354 pKa = 3.61SIAQLLTDD362 pKa = 3.62NADD365 pKa = 3.85RR366 pKa = 11.84TSSLASS372 pKa = 3.36
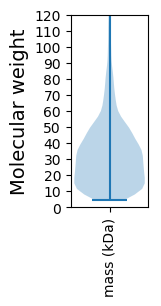
Molecular weight: 38.69 kDa
Isoelectric point according different methods:
Protein with the highest isoelectric point:
>tr|A0A0D6MS39|A0A0D6MS39_ACEAC SnoaL-like domain-containing protein OS=Acetobacter aceti NBRC 14818 OX=887700 GN=Abac_003_080 PE=4 SV=1
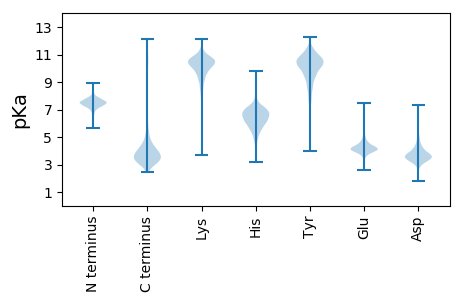
MM1 pKa = 7.35KK2 pKa = 9.43RR3 pKa = 11.84TYY5 pKa = 10.27QPSKK9 pKa = 9.73LVRR12 pKa = 11.84KK13 pKa = 9.15RR14 pKa = 11.84RR15 pKa = 11.84HH16 pKa = 4.54GFRR19 pKa = 11.84ARR21 pKa = 11.84TEE23 pKa = 4.29TVGGRR28 pKa = 11.84RR29 pKa = 11.84ILANRR34 pKa = 11.84RR35 pKa = 11.84SKK37 pKa = 10.5GRR39 pKa = 11.84KK40 pKa = 8.72RR41 pKa = 11.84LSAA44 pKa = 3.96
MM1 pKa = 7.35KK2 pKa = 9.43RR3 pKa = 11.84TYY5 pKa = 10.27QPSKK9 pKa = 9.73LVRR12 pKa = 11.84KK13 pKa = 9.15RR14 pKa = 11.84RR15 pKa = 11.84HH16 pKa = 4.54GFRR19 pKa = 11.84ARR21 pKa = 11.84TEE23 pKa = 4.29TVGGRR28 pKa = 11.84RR29 pKa = 11.84ILANRR34 pKa = 11.84RR35 pKa = 11.84SKK37 pKa = 10.5GRR39 pKa = 11.84KK40 pKa = 8.72RR41 pKa = 11.84LSAA44 pKa = 3.96
Molecular weight: 5.24 kDa
Isoelectric point according different methods:
Peptides (in silico digests for buttom-up proteomics)
Below you can find in silico digests of the whole proteome with Trypsin, Chymotrypsin, Trypsin+LysC, LysN, ArgC proteases suitable for different mass spec machines.| Try ESI |
 |
|---|
| ChTry ESI |
 |
|---|
| ArgC ESI |
 |
|---|
| LysN ESI |
 |
|---|
| TryLysC ESI |
 |
|---|
| Try MALDI |
 |
|---|
| ChTry MALDI |
 |
|---|
| ArgC MALDI |
 |
|---|
| LysN MALDI |
 |
|---|
| TryLysC MALDI |
 |
|---|
| Try LTQ |
 |
|---|
| ChTry LTQ |
 |
|---|
| ArgC LTQ |
 |
|---|
| LysN LTQ |
 |
|---|
| TryLysC LTQ |
 |
|---|
| Try MSlow |
 |
|---|
| ChTry MSlow |
 |
|---|
| ArgC MSlow |
 |
|---|
| LysN MSlow |
 |
|---|
| TryLysC MSlow |
 |
|---|
| Try MShigh |
 |
|---|
| ChTry MShigh |
 |
|---|
| ArgC MShigh |
 |
|---|
| LysN MShigh |
 |
|---|
| TryLysC MShigh |
 |
|---|
General Statistics
Number of major isoforms |
Number of additional isoforms |
Number of all proteins |
Number of amino acids |
Min. Seq. Length |
Max. Seq. Length |
Avg. Seq. Length |
Avg. Mol. Weight |
|---|---|---|---|---|---|---|---|
0 |
1000029 |
40 |
3579 |
317.9 |
34.59 |
Amino acid frequency
Ala |
Cys |
Asp |
Glu |
Phe |
Gly |
His |
Ile |
Lys |
Leu |
|---|---|---|---|---|---|---|---|---|---|
11.204 ± 0.056 | 1.023 ± 0.014 |
5.525 ± 0.033 | 5.509 ± 0.044 |
3.651 ± 0.03 | 8.306 ± 0.048 |
2.281 ± 0.02 | 5.191 ± 0.031 |
3.293 ± 0.036 | 10.268 ± 0.049 |
Met |
Asn |
Gln |
Pro |
Arg |
Ser |
Thr |
Val |
Trp |
Tyr |
|---|---|---|---|---|---|---|---|---|---|
2.551 ± 0.019 | 2.821 ± 0.033 |
5.352 ± 0.037 | 3.317 ± 0.025 |
6.776 ± 0.042 | 6.202 ± 0.04 |
5.808 ± 0.038 | 7.314 ± 0.035 |
1.39 ± 0.019 | 2.216 ± 0.026 |
Most of the basic statistics you can see at this page can be downloaded from this CSV file
Proteome-pI is available under Creative Commons Attribution-NoDerivs license, for more details see here
| Reference: Kozlowski LP. Proteome-pI 2.0: Proteome Isoelectric Point Database Update. Nucleic Acids Res. 2021, doi: 10.1093/nar/gkab944 | Contact: Lukasz P. Kozlowski |
