Pepper virus A
Taxonomy: Viruses; Riboviria; Orthornavirae; Kitrinoviricota; Alsuviricetes; Tymovirales; Betaflexiviridae; Quinvirinae; Carlavirus; unclassified Carlavirus
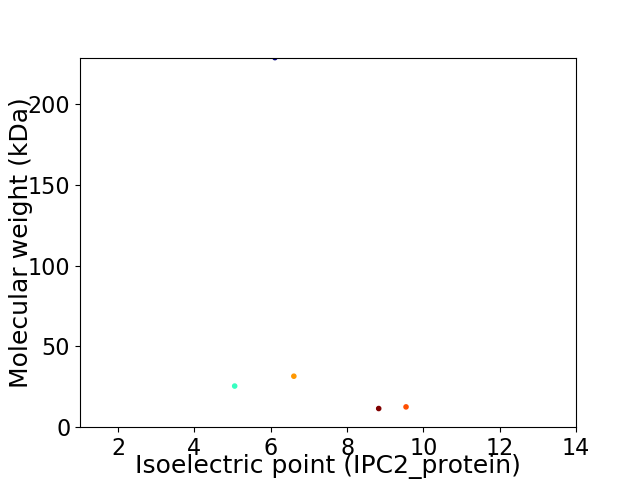
Average proteome isoelectric point is 7.15
Get precalculated fractions of proteins

Virtual 2D-PAGE plot for 5 proteins (isoelectric point calculated using IPC2_protein)
Get csv file with sequences according to given criteria:
* You can choose from 21 different methods for calculating isoelectric point
Summary statistics related to proteome-wise predictions


Protein with the lowest isoelectric point:
>tr|A0A1W5KTS4|A0A1W5KTS4_9VIRU TGB1 OS=Pepper virus A OX=1803898 GN=gp2 PE=4 SV=1
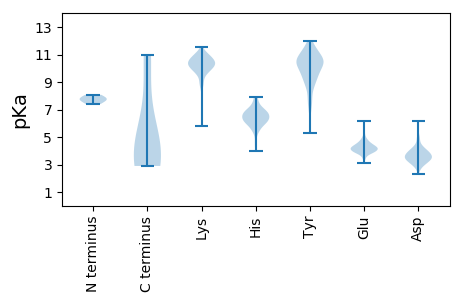
MM1 pKa = 7.4LCVINKK7 pKa = 9.52LVDD10 pKa = 3.59CGFSRR15 pKa = 11.84VGPSLNKK22 pKa = 9.77PLIINCVPGGGKK34 pKa = 6.45TTIIRR39 pKa = 11.84QLLEE43 pKa = 4.19EE44 pKa = 4.45FDD46 pKa = 4.26HH47 pKa = 6.72LVAYY51 pKa = 6.8TTASPDD57 pKa = 4.09PINLKK62 pKa = 10.48GNQIKK67 pKa = 10.42ALPATPEE74 pKa = 3.84EE75 pKa = 4.36GKK77 pKa = 10.77LVILDD82 pKa = 4.3EE83 pKa = 4.31YY84 pKa = 11.45QNLAKK89 pKa = 10.74LPDD92 pKa = 3.43WVDD95 pKa = 2.89IAFGDD100 pKa = 4.2PLQSCNPNLLSADD113 pKa = 3.5FLSYY117 pKa = 9.0RR118 pKa = 11.84THH120 pKa = 6.56RR121 pKa = 11.84FGRR124 pKa = 11.84NTCGLLGRR132 pKa = 11.84LGFRR136 pKa = 11.84VEE138 pKa = 4.51SDD140 pKa = 3.8LEE142 pKa = 4.23DD143 pKa = 3.47SVVFEE148 pKa = 4.55GLFEE152 pKa = 4.78GEE154 pKa = 4.54LEE156 pKa = 4.22GQILCCEE163 pKa = 4.18QEE165 pKa = 4.21VEE167 pKa = 4.32EE168 pKa = 5.0LLTSHH173 pKa = 6.31SVEE176 pKa = 3.96FLTPRR181 pKa = 11.84TAQGKK186 pKa = 5.81TFEE189 pKa = 4.69VVTFCCSEE197 pKa = 3.99RR198 pKa = 11.84PLANNLHH205 pKa = 6.79LYY207 pKa = 8.88LICLTRR213 pKa = 11.84HH214 pKa = 4.49TSKK217 pKa = 10.82LRR219 pKa = 11.84ILNPEE224 pKa = 3.76GAAGFFF230 pKa = 3.95
MM1 pKa = 7.4LCVINKK7 pKa = 9.52LVDD10 pKa = 3.59CGFSRR15 pKa = 11.84VGPSLNKK22 pKa = 9.77PLIINCVPGGGKK34 pKa = 6.45TTIIRR39 pKa = 11.84QLLEE43 pKa = 4.19EE44 pKa = 4.45FDD46 pKa = 4.26HH47 pKa = 6.72LVAYY51 pKa = 6.8TTASPDD57 pKa = 4.09PINLKK62 pKa = 10.48GNQIKK67 pKa = 10.42ALPATPEE74 pKa = 3.84EE75 pKa = 4.36GKK77 pKa = 10.77LVILDD82 pKa = 4.3EE83 pKa = 4.31YY84 pKa = 11.45QNLAKK89 pKa = 10.74LPDD92 pKa = 3.43WVDD95 pKa = 2.89IAFGDD100 pKa = 4.2PLQSCNPNLLSADD113 pKa = 3.5FLSYY117 pKa = 9.0RR118 pKa = 11.84THH120 pKa = 6.56RR121 pKa = 11.84FGRR124 pKa = 11.84NTCGLLGRR132 pKa = 11.84LGFRR136 pKa = 11.84VEE138 pKa = 4.51SDD140 pKa = 3.8LEE142 pKa = 4.23DD143 pKa = 3.47SVVFEE148 pKa = 4.55GLFEE152 pKa = 4.78GEE154 pKa = 4.54LEE156 pKa = 4.22GQILCCEE163 pKa = 4.18QEE165 pKa = 4.21VEE167 pKa = 4.32EE168 pKa = 5.0LLTSHH173 pKa = 6.31SVEE176 pKa = 3.96FLTPRR181 pKa = 11.84TAQGKK186 pKa = 5.81TFEE189 pKa = 4.69VVTFCCSEE197 pKa = 3.99RR198 pKa = 11.84PLANNLHH205 pKa = 6.79LYY207 pKa = 8.88LICLTRR213 pKa = 11.84HH214 pKa = 4.49TSKK217 pKa = 10.82LRR219 pKa = 11.84ILNPEE224 pKa = 3.76GAAGFFF230 pKa = 3.95
Molecular weight: 25.49 kDa
Isoelectric point according different methods:
Protein with the highest isoelectric point:
>tr|A0A1W5KTS4|A0A1W5KTS4_9VIRU TGB1 OS=Pepper virus A OX=1803898 GN=gp2 PE=4 SV=1
MM1 pKa = 8.07IPMKK5 pKa = 10.28EE6 pKa = 3.8RR7 pKa = 11.84AVALAIAASRR17 pKa = 11.84LGRR20 pKa = 11.84HH21 pKa = 5.87LPFDD25 pKa = 3.63VCLYY29 pKa = 10.15ICSFNYY35 pKa = 9.55KK36 pKa = 10.05DD37 pKa = 3.84CVGSGRR43 pKa = 11.84SSYY46 pKa = 10.48ARR48 pKa = 11.84KK49 pKa = 9.6RR50 pKa = 11.84RR51 pKa = 11.84AKK53 pKa = 10.22SIRR56 pKa = 11.84RR57 pKa = 11.84CHH59 pKa = 5.5RR60 pKa = 11.84CFRR63 pKa = 11.84VRR65 pKa = 11.84PGFYY69 pKa = 9.3FTTRR73 pKa = 11.84CDD75 pKa = 3.77GVSCKK80 pKa = 10.24PGISYY85 pKa = 7.76PIWVEE90 pKa = 3.15LFIRR94 pKa = 11.84FGIPRR99 pKa = 11.84SMSTSGTEE107 pKa = 3.76EE108 pKa = 3.9RR109 pKa = 11.84GG110 pKa = 3.36
MM1 pKa = 8.07IPMKK5 pKa = 10.28EE6 pKa = 3.8RR7 pKa = 11.84AVALAIAASRR17 pKa = 11.84LGRR20 pKa = 11.84HH21 pKa = 5.87LPFDD25 pKa = 3.63VCLYY29 pKa = 10.15ICSFNYY35 pKa = 9.55KK36 pKa = 10.05DD37 pKa = 3.84CVGSGRR43 pKa = 11.84SSYY46 pKa = 10.48ARR48 pKa = 11.84KK49 pKa = 9.6RR50 pKa = 11.84RR51 pKa = 11.84AKK53 pKa = 10.22SIRR56 pKa = 11.84RR57 pKa = 11.84CHH59 pKa = 5.5RR60 pKa = 11.84CFRR63 pKa = 11.84VRR65 pKa = 11.84PGFYY69 pKa = 9.3FTTRR73 pKa = 11.84CDD75 pKa = 3.77GVSCKK80 pKa = 10.24PGISYY85 pKa = 7.76PIWVEE90 pKa = 3.15LFIRR94 pKa = 11.84FGIPRR99 pKa = 11.84SMSTSGTEE107 pKa = 3.76EE108 pKa = 3.9RR109 pKa = 11.84GG110 pKa = 3.36
Molecular weight: 12.58 kDa
Isoelectric point according different methods:
Peptides (in silico digests for buttom-up proteomics)
Below you can find in silico digests of the whole proteome with Trypsin, Chymotrypsin, Trypsin+LysC, LysN, ArgC proteases suitable for different mass spec machines.| Try ESI |
 |
|---|
| ChTry ESI |
 |
|---|
| ArgC ESI |
 |
|---|
| LysN ESI |
 |
|---|
| TryLysC ESI |
 |
|---|
| Try MALDI |
 |
|---|
| ChTry MALDI |
 |
|---|
| ArgC MALDI |
 |
|---|
| LysN MALDI |
 |
|---|
| TryLysC MALDI |
 |
|---|
| Try LTQ |
 |
|---|
| ChTry LTQ |
 |
|---|
| ArgC LTQ |
 |
|---|
| LysN LTQ |
 |
|---|
| TryLysC LTQ |
 |
|---|
| Try MSlow |
 |
|---|
| ChTry MSlow |
 |
|---|
| ArgC MSlow |
 |
|---|
| LysN MSlow |
 |
|---|
| TryLysC MSlow |
 |
|---|
| Try MShigh |
 |
|---|
| ChTry MShigh |
 |
|---|
| ArgC MShigh |
 |
|---|
| LysN MShigh |
 |
|---|
| TryLysC MShigh |
 |
|---|
General Statistics
Number of major isoforms |
Number of additional isoforms |
Number of all proteins |
Number of amino acids |
Min. Seq. Length |
Max. Seq. Length |
Avg. Seq. Length |
Avg. Mol. Weight |
|---|---|---|---|---|---|---|---|
0 |
2767 |
107 |
2037 |
553.4 |
62.02 |
Amino acid frequency
Ala |
Cys |
Asp |
Glu |
Phe |
Gly |
His |
Ile |
Lys |
Leu |
|---|---|---|---|---|---|---|---|---|---|
7.228 ± 1.051 | 2.891 ± 0.616 |
5.132 ± 0.481 | 6.397 ± 0.889 |
4.59 ± 0.567 | 6.397 ± 0.525 |
2.458 ± 0.264 | 5.168 ± 0.301 |
5.71 ± 0.769 | 10.264 ± 1.145 |
Met |
Asn |
Gln |
Pro |
Arg |
Ser |
Thr |
Val |
Trp |
Tyr |
|---|---|---|---|---|---|---|---|---|---|
1.988 ± 0.363 | 4.192 ± 0.528 |
4.301 ± 0.851 | 3.433 ± 0.453 |
5.746 ± 1.122 | 7.409 ± 0.582 |
5.24 ± 0.535 | 6.903 ± 0.332 |
0.976 ± 0.199 | 3.578 ± 0.303 |
Most of the basic statistics you can see at this page can be downloaded from this CSV file
Proteome-pI is available under Creative Commons Attribution-NoDerivs license, for more details see here
| Reference: Kozlowski LP. Proteome-pI 2.0: Proteome Isoelectric Point Database Update. Nucleic Acids Res. 2021, doi: 10.1093/nar/gkab944 | Contact: Lukasz P. Kozlowski |
