Flavobacterium kingsejongi
Taxonomy: cellular organisms; Bacteria; FCB group; Bacteroidetes/Chlorobi group; Bacteroidetes; Flavobacteriia; Flavobacteriales; Flavobacteriaceae; Flavobacterium
Average proteome isoelectric point is 6.62
Get precalculated fractions of proteins

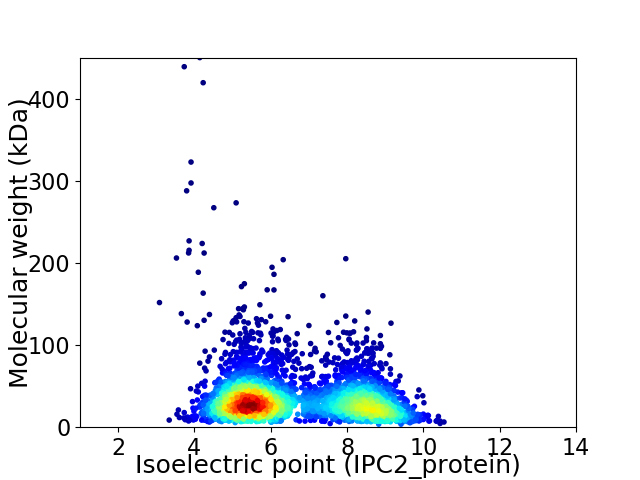
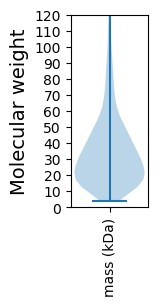
Virtual 2D-PAGE plot for 3535 proteins (isoelectric point calculated using IPC2_protein)
Get csv file with sequences according to given criteria:
* You can choose from 21 different methods for calculating isoelectric point
Summary statistics related to proteome-wise predictions


Protein with the lowest isoelectric point:
>tr|A0A2S1LL23|A0A2S1LL23_9FLAO NAD(P)-dependent oxidoreductase OS=Flavobacterium kingsejongi OX=1678728 GN=FK004_03965 PE=3 SV=1
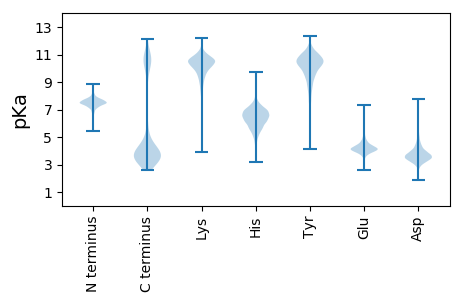
MM1 pKa = 7.25TLANALQLIPSFWDD15 pKa = 3.35PEE17 pKa = 4.22EE18 pKa = 4.24PFPFGKK24 pKa = 9.78NDD26 pKa = 3.43HH27 pKa = 6.76SNHH30 pKa = 5.2IQRR33 pKa = 11.84LQEE36 pKa = 3.98EE37 pKa = 4.75FKK39 pKa = 11.29DD40 pKa = 3.98DD41 pKa = 4.49LPDD44 pKa = 3.82SLLEE48 pKa = 4.16YY49 pKa = 10.42IRR51 pKa = 11.84TAVPDD56 pKa = 3.57EE57 pKa = 5.11DD58 pKa = 4.57VDD60 pKa = 4.31FTNVGSTITLYY71 pKa = 11.24GIDD74 pKa = 3.73RR75 pKa = 11.84LKK77 pKa = 10.93YY78 pKa = 8.94LQPGYY83 pKa = 11.08NYY85 pKa = 10.03DD86 pKa = 4.1EE87 pKa = 5.15KK88 pKa = 10.83SQSPIEE94 pKa = 4.4SDD96 pKa = 2.65WKK98 pKa = 11.03ASFFVIGDD106 pKa = 3.57EE107 pKa = 4.84DD108 pKa = 4.58GDD110 pKa = 4.68PILIDD115 pKa = 3.66LQEE118 pKa = 4.9PEE120 pKa = 5.04DD121 pKa = 4.73GILVLEE127 pKa = 4.86HH128 pKa = 6.96GAGSWEE134 pKa = 4.13YY135 pKa = 11.07GEE137 pKa = 5.25SRR139 pKa = 11.84AATIGQFLLCSAAQHH154 pKa = 5.23QMLMADD160 pKa = 4.35EE161 pKa = 5.2DD162 pKa = 5.14PIVDD166 pKa = 5.03DD167 pKa = 4.45EE168 pKa = 6.44DD169 pKa = 4.75GFCLHH174 pKa = 7.21PEE176 pKa = 3.79VANWYY181 pKa = 8.3FPKK184 pKa = 9.48MKK186 pKa = 9.48EE187 pKa = 4.22WAGHH191 pKa = 6.2YY192 pKa = 9.45YY193 pKa = 10.01PEE195 pKa = 4.25WCSVFDD201 pKa = 3.98NSS203 pKa = 5.2
MM1 pKa = 7.25TLANALQLIPSFWDD15 pKa = 3.35PEE17 pKa = 4.22EE18 pKa = 4.24PFPFGKK24 pKa = 9.78NDD26 pKa = 3.43HH27 pKa = 6.76SNHH30 pKa = 5.2IQRR33 pKa = 11.84LQEE36 pKa = 3.98EE37 pKa = 4.75FKK39 pKa = 11.29DD40 pKa = 3.98DD41 pKa = 4.49LPDD44 pKa = 3.82SLLEE48 pKa = 4.16YY49 pKa = 10.42IRR51 pKa = 11.84TAVPDD56 pKa = 3.57EE57 pKa = 5.11DD58 pKa = 4.57VDD60 pKa = 4.31FTNVGSTITLYY71 pKa = 11.24GIDD74 pKa = 3.73RR75 pKa = 11.84LKK77 pKa = 10.93YY78 pKa = 8.94LQPGYY83 pKa = 11.08NYY85 pKa = 10.03DD86 pKa = 4.1EE87 pKa = 5.15KK88 pKa = 10.83SQSPIEE94 pKa = 4.4SDD96 pKa = 2.65WKK98 pKa = 11.03ASFFVIGDD106 pKa = 3.57EE107 pKa = 4.84DD108 pKa = 4.58GDD110 pKa = 4.68PILIDD115 pKa = 3.66LQEE118 pKa = 4.9PEE120 pKa = 5.04DD121 pKa = 4.73GILVLEE127 pKa = 4.86HH128 pKa = 6.96GAGSWEE134 pKa = 4.13YY135 pKa = 11.07GEE137 pKa = 5.25SRR139 pKa = 11.84AATIGQFLLCSAAQHH154 pKa = 5.23QMLMADD160 pKa = 4.35EE161 pKa = 5.2DD162 pKa = 5.14PIVDD166 pKa = 5.03DD167 pKa = 4.45EE168 pKa = 6.44DD169 pKa = 4.75GFCLHH174 pKa = 7.21PEE176 pKa = 3.79VANWYY181 pKa = 8.3FPKK184 pKa = 9.48MKK186 pKa = 9.48EE187 pKa = 4.22WAGHH191 pKa = 6.2YY192 pKa = 9.45YY193 pKa = 10.01PEE195 pKa = 4.25WCSVFDD201 pKa = 3.98NSS203 pKa = 5.2
Molecular weight: 23.22 kDa
Isoelectric point according different methods:
Protein with the highest isoelectric point:
>tr|A0A2S1LUD7|A0A2S1LUD7_9FLAO Cyclic nucleotide-binding protein OS=Flavobacterium kingsejongi OX=1678728 GN=FK004_16115 PE=4 SV=1
MM1 pKa = 8.29DD2 pKa = 3.49IRR4 pKa = 11.84RR5 pKa = 11.84RR6 pKa = 11.84TGSRR10 pKa = 11.84TLFLDD15 pKa = 4.25KK16 pKa = 9.37MTEE19 pKa = 4.09KK20 pKa = 10.57INARR24 pKa = 11.84MNQRR28 pKa = 11.84DD29 pKa = 3.54EE30 pKa = 4.06
MM1 pKa = 8.29DD2 pKa = 3.49IRR4 pKa = 11.84RR5 pKa = 11.84RR6 pKa = 11.84TGSRR10 pKa = 11.84TLFLDD15 pKa = 4.25KK16 pKa = 9.37MTEE19 pKa = 4.09KK20 pKa = 10.57INARR24 pKa = 11.84MNQRR28 pKa = 11.84DD29 pKa = 3.54EE30 pKa = 4.06
Molecular weight: 3.68 kDa
Isoelectric point according different methods:
Peptides (in silico digests for buttom-up proteomics)
Below you can find in silico digests of the whole proteome with Trypsin, Chymotrypsin, Trypsin+LysC, LysN, ArgC proteases suitable for different mass spec machines.| Try ESI |
 |
|---|
| ChTry ESI |
 |
|---|
| ArgC ESI |
 |
|---|
| LysN ESI |
 |
|---|
| TryLysC ESI |
 |
|---|
| Try MALDI |
 |
|---|
| ChTry MALDI |
 |
|---|
| ArgC MALDI |
 |
|---|
| LysN MALDI |
 |
|---|
| TryLysC MALDI |
 |
|---|
| Try LTQ |
 |
|---|
| ChTry LTQ |
 |
|---|
| ArgC LTQ |
 |
|---|
| LysN LTQ |
 |
|---|
| TryLysC LTQ |
 |
|---|
| Try MSlow |
 |
|---|
| ChTry MSlow |
 |
|---|
| ArgC MSlow |
 |
|---|
| LysN MSlow |
 |
|---|
| TryLysC MSlow |
 |
|---|
| Try MShigh |
 |
|---|
| ChTry MShigh |
 |
|---|
| ArgC MShigh |
 |
|---|
| LysN MShigh |
 |
|---|
| TryLysC MShigh |
 |
|---|
General Statistics
Number of major isoforms |
Number of additional isoforms |
Number of all proteins |
Number of amino acids |
Min. Seq. Length |
Max. Seq. Length |
Avg. Seq. Length |
Avg. Mol. Weight |
|---|---|---|---|---|---|---|---|
0 |
1176805 |
30 |
4271 |
332.9 |
37.37 |
Amino acid frequency
Ala |
Cys |
Asp |
Glu |
Phe |
Gly |
His |
Ile |
Lys |
Leu |
|---|---|---|---|---|---|---|---|---|---|
7.223 ± 0.052 | 0.767 ± 0.018 |
5.256 ± 0.035 | 6.178 ± 0.047 |
5.019 ± 0.043 | 6.469 ± 0.046 |
1.794 ± 0.021 | 7.748 ± 0.046 |
7.298 ± 0.076 | 9.235 ± 0.053 |
Met |
Asn |
Gln |
Pro |
Arg |
Ser |
Thr |
Val |
Trp |
Tyr |
|---|---|---|---|---|---|---|---|---|---|
2.241 ± 0.026 | 5.792 ± 0.044 |
3.642 ± 0.035 | 3.638 ± 0.025 |
3.455 ± 0.028 | 6.23 ± 0.031 |
6.493 ± 0.099 | 6.299 ± 0.042 |
1.007 ± 0.017 | 4.215 ± 0.03 |
Most of the basic statistics you can see at this page can be downloaded from this CSV file
Proteome-pI is available under Creative Commons Attribution-NoDerivs license, for more details see here
| Reference: Kozlowski LP. Proteome-pI 2.0: Proteome Isoelectric Point Database Update. Nucleic Acids Res. 2021, doi: 10.1093/nar/gkab944 | Contact: Lukasz P. Kozlowski |
