Agrobacterium phage Atu_ph08
Taxonomy: Viruses; Duplodnaviria; Heunggongvirae; Uroviricota; Caudoviricetes; Caudovirales; Podoviridae; unclassified Podoviridae
Average proteome isoelectric point is 6.68
Get precalculated fractions of proteins

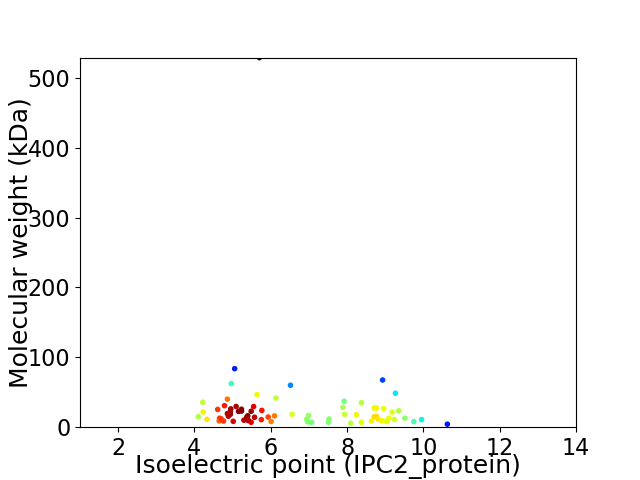
Virtual 2D-PAGE plot for 75 proteins (isoelectric point calculated using IPC2_protein)
Get csv file with sequences according to given criteria:
* You can choose from 21 different methods for calculating isoelectric point
Summary statistics related to proteome-wise predictions


Protein with the lowest isoelectric point:
>tr|A0A223W0E1|A0A223W0E1_9CAUD Uncharacterized protein OS=Agrobacterium phage Atu_ph08 OX=2024265 PE=4 SV=1
MM1 pKa = 6.66THH3 pKa = 6.49EE4 pKa = 4.91DD5 pKa = 3.16LRR7 pKa = 11.84KK8 pKa = 9.48RR9 pKa = 11.84WTEE12 pKa = 3.36ANEE15 pKa = 4.0RR16 pKa = 11.84VEE18 pKa = 5.52LLDD21 pKa = 3.34KK22 pKa = 10.79QRR24 pKa = 11.84YY25 pKa = 6.62QLVEE29 pKa = 3.87HH30 pKa = 6.41TQQEE34 pKa = 4.17WLEE37 pKa = 4.19AQTEE41 pKa = 4.39FQAVVDD47 pKa = 3.85EE48 pKa = 4.85CLNGDD53 pKa = 3.77AFLCEE58 pKa = 4.39ACDD61 pKa = 3.75APIFPGDD68 pKa = 3.45QYY70 pKa = 11.4HH71 pKa = 6.96AGVEE75 pKa = 4.25PRR77 pKa = 11.84CFEE80 pKa = 4.35CAPTYY85 pKa = 10.92QSMIDD90 pKa = 3.68EE91 pKa = 4.76PEE93 pKa = 4.23GFVDD97 pKa = 6.44LVDD100 pKa = 4.77EE101 pKa = 4.93SPSTPEE107 pKa = 3.6NLRR110 pKa = 11.84AAFDD114 pKa = 3.37AHH116 pKa = 6.31IAAGGSPDD124 pKa = 3.57DD125 pKa = 4.96KK126 pKa = 10.73MVEE129 pKa = 4.22VYY131 pKa = 10.5DD132 pKa = 3.8
MM1 pKa = 6.66THH3 pKa = 6.49EE4 pKa = 4.91DD5 pKa = 3.16LRR7 pKa = 11.84KK8 pKa = 9.48RR9 pKa = 11.84WTEE12 pKa = 3.36ANEE15 pKa = 4.0RR16 pKa = 11.84VEE18 pKa = 5.52LLDD21 pKa = 3.34KK22 pKa = 10.79QRR24 pKa = 11.84YY25 pKa = 6.62QLVEE29 pKa = 3.87HH30 pKa = 6.41TQQEE34 pKa = 4.17WLEE37 pKa = 4.19AQTEE41 pKa = 4.39FQAVVDD47 pKa = 3.85EE48 pKa = 4.85CLNGDD53 pKa = 3.77AFLCEE58 pKa = 4.39ACDD61 pKa = 3.75APIFPGDD68 pKa = 3.45QYY70 pKa = 11.4HH71 pKa = 6.96AGVEE75 pKa = 4.25PRR77 pKa = 11.84CFEE80 pKa = 4.35CAPTYY85 pKa = 10.92QSMIDD90 pKa = 3.68EE91 pKa = 4.76PEE93 pKa = 4.23GFVDD97 pKa = 6.44LVDD100 pKa = 4.77EE101 pKa = 4.93SPSTPEE107 pKa = 3.6NLRR110 pKa = 11.84AAFDD114 pKa = 3.37AHH116 pKa = 6.31IAAGGSPDD124 pKa = 3.57DD125 pKa = 4.96KK126 pKa = 10.73MVEE129 pKa = 4.22VYY131 pKa = 10.5DD132 pKa = 3.8
Molecular weight: 15.01 kDa
Isoelectric point according different methods:
Protein with the highest isoelectric point:
>tr|A0A2L0V100|A0A2L0V100_9CAUD Uncharacterized protein OS=Agrobacterium phage Atu_ph08 OX=2024265 PE=4 SV=1
MM1 pKa = 7.16TRR3 pKa = 11.84LPASTYY9 pKa = 10.72RR10 pKa = 11.84KK11 pKa = 7.51NTKK14 pKa = 8.64PKK16 pKa = 10.32KK17 pKa = 8.53RR18 pKa = 11.84VTMARR23 pKa = 11.84RR24 pKa = 11.84NAKK27 pKa = 9.55RR28 pKa = 11.84DD29 pKa = 3.29AAEE32 pKa = 3.99PEE34 pKa = 4.0IVKK37 pKa = 9.17TLEE40 pKa = 3.94AFGMSVFLLHH50 pKa = 6.97EE51 pKa = 4.45PTDD54 pKa = 4.5AIVGYY59 pKa = 10.3RR60 pKa = 11.84GITHH64 pKa = 5.58VVEE67 pKa = 5.62FKK69 pKa = 10.62SGRR72 pKa = 11.84KK73 pKa = 9.72GYY75 pKa = 9.98GAALNDD81 pKa = 3.63NQQAFADD88 pKa = 3.83AWRR91 pKa = 11.84GSAVVTLHH99 pKa = 6.59SVDD102 pKa = 4.1EE103 pKa = 4.36AVVWAQQVRR112 pKa = 11.84RR113 pKa = 11.84GQPP116 pKa = 2.76
MM1 pKa = 7.16TRR3 pKa = 11.84LPASTYY9 pKa = 10.72RR10 pKa = 11.84KK11 pKa = 7.51NTKK14 pKa = 8.64PKK16 pKa = 10.32KK17 pKa = 8.53RR18 pKa = 11.84VTMARR23 pKa = 11.84RR24 pKa = 11.84NAKK27 pKa = 9.55RR28 pKa = 11.84DD29 pKa = 3.29AAEE32 pKa = 3.99PEE34 pKa = 4.0IVKK37 pKa = 9.17TLEE40 pKa = 3.94AFGMSVFLLHH50 pKa = 6.97EE51 pKa = 4.45PTDD54 pKa = 4.5AIVGYY59 pKa = 10.3RR60 pKa = 11.84GITHH64 pKa = 5.58VVEE67 pKa = 5.62FKK69 pKa = 10.62SGRR72 pKa = 11.84KK73 pKa = 9.72GYY75 pKa = 9.98GAALNDD81 pKa = 3.63NQQAFADD88 pKa = 3.83AWRR91 pKa = 11.84GSAVVTLHH99 pKa = 6.59SVDD102 pKa = 4.1EE103 pKa = 4.36AVVWAQQVRR112 pKa = 11.84RR113 pKa = 11.84GQPP116 pKa = 2.76
Molecular weight: 12.92 kDa
Isoelectric point according different methods:
Peptides (in silico digests for buttom-up proteomics)
Below you can find in silico digests of the whole proteome with Trypsin, Chymotrypsin, Trypsin+LysC, LysN, ArgC proteases suitable for different mass spec machines.| Try ESI |
 |
|---|
| ChTry ESI |
 |
|---|
| ArgC ESI |
 |
|---|
| LysN ESI |
 |
|---|
| TryLysC ESI |
 |
|---|
| Try MALDI |
 |
|---|
| ChTry MALDI |
 |
|---|
| ArgC MALDI |
 |
|---|
| LysN MALDI |
 |
|---|
| TryLysC MALDI |
 |
|---|
| Try LTQ |
 |
|---|
| ChTry LTQ |
 |
|---|
| ArgC LTQ |
 |
|---|
| LysN LTQ |
 |
|---|
| TryLysC LTQ |
 |
|---|
| Try MSlow |
 |
|---|
| ChTry MSlow |
 |
|---|
| ArgC MSlow |
 |
|---|
| LysN MSlow |
 |
|---|
| TryLysC MSlow |
 |
|---|
| Try MShigh |
 |
|---|
| ChTry MShigh |
 |
|---|
| ArgC MShigh |
 |
|---|
| LysN MShigh |
 |
|---|
| TryLysC MShigh |
 |
|---|
General Statistics
Number of major isoforms |
Number of additional isoforms |
Number of all proteins |
Number of amino acids |
Min. Seq. Length |
Max. Seq. Length |
Avg. Seq. Length |
Avg. Mol. Weight |
|---|---|---|---|---|---|---|---|
0 |
18864 |
40 |
4877 |
251.5 |
27.66 |
Amino acid frequency
Ala |
Cys |
Asp |
Glu |
Phe |
Gly |
His |
Ile |
Lys |
Leu |
|---|---|---|---|---|---|---|---|---|---|
12.23 ± 0.392 | 0.769 ± 0.183 |
6.526 ± 0.227 | 6.648 ± 0.245 |
3.138 ± 0.17 | 7.766 ± 0.371 |
2.062 ± 0.181 | 4.978 ± 0.246 |
5.481 ± 0.259 | 7.581 ± 0.251 |
Met |
Asn |
Gln |
Pro |
Arg |
Ser |
Thr |
Val |
Trp |
Tyr |
|---|---|---|---|---|---|---|---|---|---|
2.502 ± 0.124 | 3.488 ± 0.185 |
4.962 ± 0.183 | 3.923 ± 0.218 |
6.87 ± 0.24 | 5.211 ± 0.179 |
5.529 ± 0.127 | 6.287 ± 0.192 |
1.771 ± 0.145 | 2.279 ± 0.112 |
Most of the basic statistics you can see at this page can be downloaded from this CSV file
Proteome-pI is available under Creative Commons Attribution-NoDerivs license, for more details see here
| Reference: Kozlowski LP. Proteome-pI 2.0: Proteome Isoelectric Point Database Update. Nucleic Acids Res. 2021, doi: 10.1093/nar/gkab944 | Contact: Lukasz P. Kozlowski |
