Mesorhizobium amorphae CCBAU 01583
Taxonomy: cellular organisms; Bacteria; Proteobacteria; Alphaproteobacteria; Hyphomicrobiales; Phyllobacteriaceae; Mesorhizobium; Mesorhizobium amorphae
Average proteome isoelectric point is 7.22
Get precalculated fractions of proteins

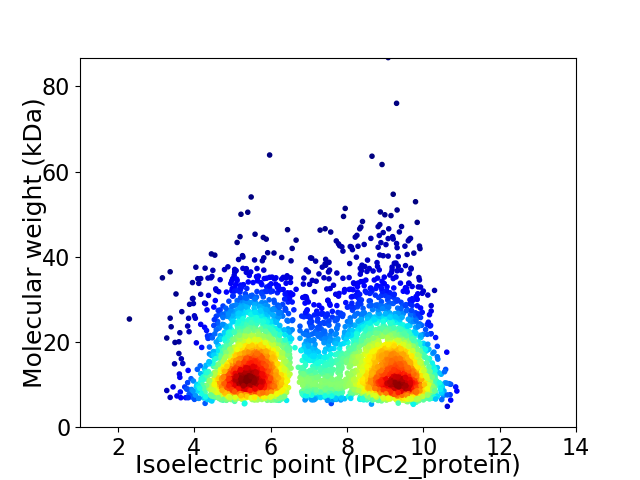
Virtual 2D-PAGE plot for 4266 proteins (isoelectric point calculated using IPC2_protein)
Get csv file with sequences according to given criteria:
* You can choose from 21 different methods for calculating isoelectric point
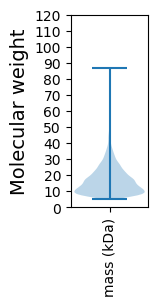
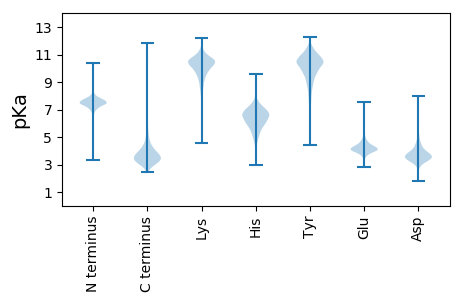
Summary statistics related to proteome-wise predictions


Protein with the lowest isoelectric point:
>tr|A0A212DJJ8|A0A212DJJ8_9RHIZ Acetyltransferase OS=Mesorhizobium amorphae CCBAU 01583 OX=1449348 GN=AJ88_05185 PE=4 SV=1
MM1 pKa = 7.57SMKK4 pKa = 10.54KK5 pKa = 10.43LILGLSLSLLASSAFAADD23 pKa = 3.3AVVQEE28 pKa = 4.81GVDD31 pKa = 3.71VAPVFSWTGGYY42 pKa = 9.53IGLQAGYY49 pKa = 10.36AWGDD53 pKa = 3.6GNIDD57 pKa = 3.75QIDD60 pKa = 4.03GPGFVEE66 pKa = 4.17TDD68 pKa = 3.06PDD70 pKa = 3.86GFLGGVYY77 pKa = 10.19AGYY80 pKa = 10.37NYY82 pKa = 10.35QMSSNIVIGAEE93 pKa = 3.73LDD95 pKa = 3.84FVFAGIDD102 pKa = 3.39GSGQIFTAPGVPFPGAIATEE122 pKa = 4.04EE123 pKa = 4.41LNWSGAARR131 pKa = 11.84LRR133 pKa = 11.84LGYY136 pKa = 10.56AVDD139 pKa = 3.97RR140 pKa = 11.84FLPYY144 pKa = 9.91IAGGVAFGDD153 pKa = 3.47IDD155 pKa = 3.38ISTNSGAPSFGDD167 pKa = 3.54TFTGWTIGVGLDD179 pKa = 3.46YY180 pKa = 11.81AMTDD184 pKa = 3.1NLLLRR189 pKa = 11.84TEE191 pKa = 3.97YY192 pKa = 10.46RR193 pKa = 11.84YY194 pKa = 8.57TDD196 pKa = 3.85FGSEE200 pKa = 4.35SFGPPANADD209 pKa = 2.98VDD211 pKa = 4.55LKK213 pKa = 9.97TNEE216 pKa = 3.65VRR218 pKa = 11.84FGIAYY223 pKa = 9.45KK224 pKa = 10.53FF225 pKa = 3.41
MM1 pKa = 7.57SMKK4 pKa = 10.54KK5 pKa = 10.43LILGLSLSLLASSAFAADD23 pKa = 3.3AVVQEE28 pKa = 4.81GVDD31 pKa = 3.71VAPVFSWTGGYY42 pKa = 9.53IGLQAGYY49 pKa = 10.36AWGDD53 pKa = 3.6GNIDD57 pKa = 3.75QIDD60 pKa = 4.03GPGFVEE66 pKa = 4.17TDD68 pKa = 3.06PDD70 pKa = 3.86GFLGGVYY77 pKa = 10.19AGYY80 pKa = 10.37NYY82 pKa = 10.35QMSSNIVIGAEE93 pKa = 3.73LDD95 pKa = 3.84FVFAGIDD102 pKa = 3.39GSGQIFTAPGVPFPGAIATEE122 pKa = 4.04EE123 pKa = 4.41LNWSGAARR131 pKa = 11.84LRR133 pKa = 11.84LGYY136 pKa = 10.56AVDD139 pKa = 3.97RR140 pKa = 11.84FLPYY144 pKa = 9.91IAGGVAFGDD153 pKa = 3.47IDD155 pKa = 3.38ISTNSGAPSFGDD167 pKa = 3.54TFTGWTIGVGLDD179 pKa = 3.46YY180 pKa = 11.81AMTDD184 pKa = 3.1NLLLRR189 pKa = 11.84TEE191 pKa = 3.97YY192 pKa = 10.46RR193 pKa = 11.84YY194 pKa = 8.57TDD196 pKa = 3.85FGSEE200 pKa = 4.35SFGPPANADD209 pKa = 2.98VDD211 pKa = 4.55LKK213 pKa = 9.97TNEE216 pKa = 3.65VRR218 pKa = 11.84FGIAYY223 pKa = 9.45KK224 pKa = 10.53FF225 pKa = 3.41
Molecular weight: 23.73 kDa
Isoelectric point according different methods:
Protein with the highest isoelectric point:
>tr|A0A212DV79|A0A212DV79_9RHIZ Uncharacterized protein OS=Mesorhizobium amorphae CCBAU 01583 OX=1449348 GN=AJ88_15440 PE=4 SV=1
MM1 pKa = 7.78RR2 pKa = 11.84GKK4 pKa = 10.71LLLVRR9 pKa = 11.84NGTKK13 pKa = 9.77RR14 pKa = 11.84VPWGRR19 pKa = 11.84STKK22 pKa = 9.89EE23 pKa = 3.64RR24 pKa = 11.84LKK26 pKa = 11.17SPTRR30 pKa = 11.84PISFGSTKK38 pKa = 9.91IAPASIHH45 pKa = 5.01TFIGIFKK52 pKa = 9.72WGTKK56 pKa = 9.43PLIGGMRR63 pKa = 11.84PRR65 pKa = 11.84LFSIAIKK72 pKa = 10.39LRR74 pKa = 11.84RR75 pKa = 3.6
MM1 pKa = 7.78RR2 pKa = 11.84GKK4 pKa = 10.71LLLVRR9 pKa = 11.84NGTKK13 pKa = 9.77RR14 pKa = 11.84VPWGRR19 pKa = 11.84STKK22 pKa = 9.89EE23 pKa = 3.64RR24 pKa = 11.84LKK26 pKa = 11.17SPTRR30 pKa = 11.84PISFGSTKK38 pKa = 9.91IAPASIHH45 pKa = 5.01TFIGIFKK52 pKa = 9.72WGTKK56 pKa = 9.43PLIGGMRR63 pKa = 11.84PRR65 pKa = 11.84LFSIAIKK72 pKa = 10.39LRR74 pKa = 11.84RR75 pKa = 3.6
Molecular weight: 8.49 kDa
Isoelectric point according different methods:
Peptides (in silico digests for buttom-up proteomics)
Below you can find in silico digests of the whole proteome with Trypsin, Chymotrypsin, Trypsin+LysC, LysN, ArgC proteases suitable for different mass spec machines.| Try ESI |
 |
|---|
| ChTry ESI |
 |
|---|
| ArgC ESI |
 |
|---|
| LysN ESI |
 |
|---|
| TryLysC ESI |
 |
|---|
| Try MALDI |
 |
|---|
| ChTry MALDI |
 |
|---|
| ArgC MALDI |
 |
|---|
| LysN MALDI |
 |
|---|
| TryLysC MALDI |
 |
|---|
| Try LTQ |
 |
|---|
| ChTry LTQ |
 |
|---|
| ArgC LTQ |
 |
|---|
| LysN LTQ |
 |
|---|
| TryLysC LTQ |
 |
|---|
| Try MSlow |
 |
|---|
| ChTry MSlow |
 |
|---|
| ArgC MSlow |
 |
|---|
| LysN MSlow |
 |
|---|
| TryLysC MSlow |
 |
|---|
| Try MShigh |
 |
|---|
| ChTry MShigh |
 |
|---|
| ArgC MShigh |
 |
|---|
| LysN MShigh |
 |
|---|
| TryLysC MShigh |
 |
|---|
General Statistics
Number of major isoforms |
Number of additional isoforms |
Number of all proteins |
Number of amino acids |
Min. Seq. Length |
Max. Seq. Length |
Avg. Seq. Length |
Avg. Mol. Weight |
|---|---|---|---|---|---|---|---|
0 |
654768 |
41 |
796 |
153.5 |
16.75 |
Amino acid frequency
Ala |
Cys |
Asp |
Glu |
Phe |
Gly |
His |
Ile |
Lys |
Leu |
|---|---|---|---|---|---|---|---|---|---|
12.034 ± 0.067 | 1.303 ± 0.019 |
5.592 ± 0.036 | 5.335 ± 0.036 |
3.579 ± 0.029 | 7.992 ± 0.044 |
2.023 ± 0.02 | 4.994 ± 0.031 |
3.601 ± 0.033 | 9.116 ± 0.047 |
Met |
Asn |
Gln |
Pro |
Arg |
Ser |
Thr |
Val |
Trp |
Tyr |
|---|---|---|---|---|---|---|---|---|---|
2.595 ± 0.02 | 2.642 ± 0.024 |
5.435 ± 0.04 | 3.196 ± 0.028 |
8.342 ± 0.05 | 6.71 ± 0.05 |
5.442 ± 0.038 | 6.696 ± 0.035 |
1.42 ± 0.02 | 1.953 ± 0.022 |
Most of the basic statistics you can see at this page can be downloaded from this CSV file
Proteome-pI is available under Creative Commons Attribution-NoDerivs license, for more details see here
| Reference: Kozlowski LP. Proteome-pI 2.0: Proteome Isoelectric Point Database Update. Nucleic Acids Res. 2021, doi: 10.1093/nar/gkab944 | Contact: Lukasz P. Kozlowski |
