Entamoeba invadens IP1
Taxonomy: cellular organisms; Eukaryota; Amoebozoa; Evosea; Archamoebae; Mastigamoebida; Entamoebidae; Entamoeba; Entamoeba invadens
Average proteome isoelectric point is 6.39
Get precalculated fractions of proteins

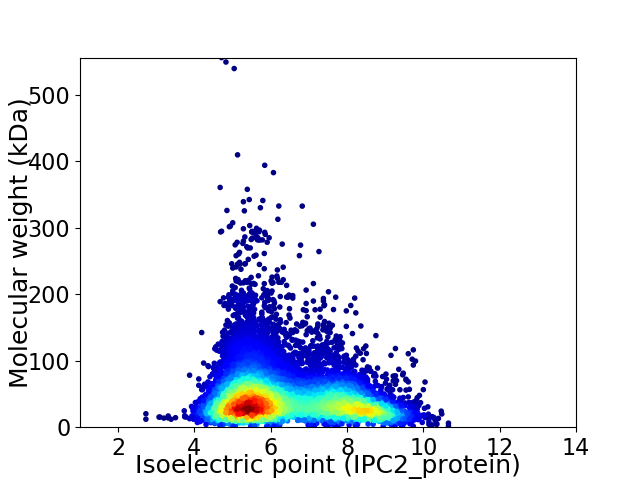
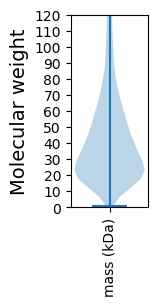
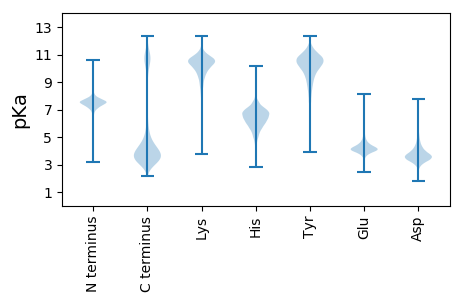
Virtual 2D-PAGE plot for 9857 proteins (isoelectric point calculated using IPC2_protein)
Get csv file with sequences according to given criteria:
* You can choose from 21 different methods for calculating isoelectric point
Summary statistics related to proteome-wise predictions


Protein with the lowest isoelectric point:
>tr|A0A0A1U0A3|A0A0A1U0A3_ENTIV Uncharacterized protein OS=Entamoeba invadens IP1 OX=370355 GN=EIN_135000 PE=4 SV=1
MM1 pKa = 7.25QNTIQFYY8 pKa = 9.55TSPAYY13 pKa = 9.18PQSLPCYY20 pKa = 8.84FQAPTLAMPNRR31 pKa = 11.84LEE33 pKa = 4.25TPFVNHH39 pKa = 6.43SFSQSQFMFAEE50 pKa = 4.08QQLPQQVVATPSVPMEE66 pKa = 4.28EE67 pKa = 4.21EE68 pKa = 4.38DD69 pKa = 3.88PFEE72 pKa = 5.24NDD74 pKa = 3.35AVFDD78 pKa = 4.28LDD80 pKa = 3.79EE81 pKa = 5.67DD82 pKa = 4.39LEE84 pKa = 4.18EE85 pKa = 6.93DD86 pKa = 3.83YY87 pKa = 11.6DD88 pKa = 3.97DD89 pKa = 3.96TNSYY93 pKa = 11.03DD94 pKa = 3.48EE95 pKa = 4.56SEE97 pKa = 4.32RR98 pKa = 11.84LADD101 pKa = 4.2QLLQTVDD108 pKa = 4.0NIRR111 pKa = 11.84QQKK114 pKa = 9.91DD115 pKa = 2.93QTNQMLRR122 pKa = 11.84QIVQMNSTHH131 pKa = 6.23
MM1 pKa = 7.25QNTIQFYY8 pKa = 9.55TSPAYY13 pKa = 9.18PQSLPCYY20 pKa = 8.84FQAPTLAMPNRR31 pKa = 11.84LEE33 pKa = 4.25TPFVNHH39 pKa = 6.43SFSQSQFMFAEE50 pKa = 4.08QQLPQQVVATPSVPMEE66 pKa = 4.28EE67 pKa = 4.21EE68 pKa = 4.38DD69 pKa = 3.88PFEE72 pKa = 5.24NDD74 pKa = 3.35AVFDD78 pKa = 4.28LDD80 pKa = 3.79EE81 pKa = 5.67DD82 pKa = 4.39LEE84 pKa = 4.18EE85 pKa = 6.93DD86 pKa = 3.83YY87 pKa = 11.6DD88 pKa = 3.97DD89 pKa = 3.96TNSYY93 pKa = 11.03DD94 pKa = 3.48EE95 pKa = 4.56SEE97 pKa = 4.32RR98 pKa = 11.84LADD101 pKa = 4.2QLLQTVDD108 pKa = 4.0NIRR111 pKa = 11.84QQKK114 pKa = 9.91DD115 pKa = 2.93QTNQMLRR122 pKa = 11.84QIVQMNSTHH131 pKa = 6.23
Molecular weight: 15.28 kDa
Isoelectric point according different methods:
Protein with the highest isoelectric point:
>tr|A0A0A1UBA8|A0A0A1UBA8_ENTIV Uncharacterized protein OS=Entamoeba invadens IP1 OX=370355 GN=EIN_523640 PE=4 SV=1
MM1 pKa = 8.47DD2 pKa = 4.46YY3 pKa = 11.54GCFKK7 pKa = 8.9TTLFKK12 pKa = 10.63IIPVLILSTFSYY24 pKa = 10.19IRR26 pKa = 11.84RR27 pKa = 11.84DD28 pKa = 3.16SLRR31 pKa = 11.84RR32 pKa = 11.84IQSLILIYY40 pKa = 10.12MLLSLLFFRR49 pKa = 11.84FSQFIVSLIIFITTQSIPNMKK70 pKa = 9.89NDD72 pKa = 3.11VPIIVSSPSRR82 pKa = 11.84LTEE85 pKa = 4.5EE86 pKa = 3.58ISSRR90 pKa = 11.84ITLKK94 pKa = 10.52PFRR97 pKa = 11.84LPKK100 pKa = 10.46SLGNCRR106 pKa = 11.84VIRR109 pKa = 11.84RR110 pKa = 11.84RR111 pKa = 11.84GICNGLAPSTKK122 pKa = 10.14SSTRR126 pKa = 11.84RR127 pKa = 11.84SNRR130 pKa = 11.84LNLSWTCWGVSRR142 pKa = 11.84VVCRR146 pKa = 11.84TLRR149 pKa = 11.84LLRR152 pKa = 11.84EE153 pKa = 3.99QARR156 pKa = 11.84VPRR159 pKa = 11.84LCYY162 pKa = 10.2NEE164 pKa = 4.49SWVCGDD170 pKa = 4.94DD171 pKa = 3.43IKK173 pKa = 11.44DD174 pKa = 3.27VAFIHH179 pKa = 6.59FDD181 pKa = 3.18QLRR184 pKa = 11.84RR185 pKa = 11.84CHH187 pKa = 6.31FCII190 pKa = 5.1
MM1 pKa = 8.47DD2 pKa = 4.46YY3 pKa = 11.54GCFKK7 pKa = 8.9TTLFKK12 pKa = 10.63IIPVLILSTFSYY24 pKa = 10.19IRR26 pKa = 11.84RR27 pKa = 11.84DD28 pKa = 3.16SLRR31 pKa = 11.84RR32 pKa = 11.84IQSLILIYY40 pKa = 10.12MLLSLLFFRR49 pKa = 11.84FSQFIVSLIIFITTQSIPNMKK70 pKa = 9.89NDD72 pKa = 3.11VPIIVSSPSRR82 pKa = 11.84LTEE85 pKa = 4.5EE86 pKa = 3.58ISSRR90 pKa = 11.84ITLKK94 pKa = 10.52PFRR97 pKa = 11.84LPKK100 pKa = 10.46SLGNCRR106 pKa = 11.84VIRR109 pKa = 11.84RR110 pKa = 11.84RR111 pKa = 11.84GICNGLAPSTKK122 pKa = 10.14SSTRR126 pKa = 11.84RR127 pKa = 11.84SNRR130 pKa = 11.84LNLSWTCWGVSRR142 pKa = 11.84VVCRR146 pKa = 11.84TLRR149 pKa = 11.84LLRR152 pKa = 11.84EE153 pKa = 3.99QARR156 pKa = 11.84VPRR159 pKa = 11.84LCYY162 pKa = 10.2NEE164 pKa = 4.49SWVCGDD170 pKa = 4.94DD171 pKa = 3.43IKK173 pKa = 11.44DD174 pKa = 3.27VAFIHH179 pKa = 6.59FDD181 pKa = 3.18QLRR184 pKa = 11.84RR185 pKa = 11.84CHH187 pKa = 6.31FCII190 pKa = 5.1
Molecular weight: 22.19 kDa
Isoelectric point according different methods:
Peptides (in silico digests for buttom-up proteomics)
Below you can find in silico digests of the whole proteome with Trypsin, Chymotrypsin, Trypsin+LysC, LysN, ArgC proteases suitable for different mass spec machines.| Try ESI |
 |
|---|
| ChTry ESI |
 |
|---|
| ArgC ESI |
 |
|---|
| LysN ESI |
 |
|---|
| TryLysC ESI |
 |
|---|
| Try MALDI |
 |
|---|
| ChTry MALDI |
 |
|---|
| ArgC MALDI |
 |
|---|
| LysN MALDI |
 |
|---|
| TryLysC MALDI |
 |
|---|
| Try LTQ |
 |
|---|
| ChTry LTQ |
 |
|---|
| ArgC LTQ |
 |
|---|
| LysN LTQ |
 |
|---|
| TryLysC LTQ |
 |
|---|
| Try MSlow |
 |
|---|
| ChTry MSlow |
 |
|---|
| ArgC MSlow |
 |
|---|
| LysN MSlow |
 |
|---|
| TryLysC MSlow |
 |
|---|
| Try MShigh |
 |
|---|
| ChTry MShigh |
 |
|---|
| ArgC MShigh |
 |
|---|
| LysN MShigh |
 |
|---|
| TryLysC MShigh |
 |
|---|
General Statistics
Number of major isoforms |
Number of additional isoforms |
Number of all proteins |
Number of amino acids |
Min. Seq. Length |
Max. Seq. Length |
Avg. Seq. Length |
Avg. Mol. Weight |
|---|---|---|---|---|---|---|---|
0 |
4270709 |
8 |
5004 |
433.3 |
49.35 |
Amino acid frequency
Ala |
Cys |
Asp |
Glu |
Phe |
Gly |
His |
Ile |
Lys |
Leu |
|---|---|---|---|---|---|---|---|---|---|
4.087 ± 0.02 | 3.465 ± 0.047 |
5.371 ± 0.014 | 7.132 ± 0.035 |
5.177 ± 0.021 | 4.626 ± 0.02 |
1.628 ± 0.007 | 6.96 ± 0.019 |
8.552 ± 0.033 | 8.415 ± 0.031 |
Met |
Asn |
Gln |
Pro |
Arg |
Ser |
Thr |
Val |
Trp |
Tyr |
|---|---|---|---|---|---|---|---|---|---|
2.436 ± 0.009 | 6.378 ± 0.027 |
3.346 ± 0.017 | 3.693 ± 0.019 |
3.34 ± 0.017 | 7.397 ± 0.023 |
6.635 ± 0.023 | 6.849 ± 0.019 |
0.692 ± 0.006 | 3.822 ± 0.017 |
Most of the basic statistics you can see at this page can be downloaded from this CSV file
Proteome-pI is available under Creative Commons Attribution-NoDerivs license, for more details see here
| Reference: Kozlowski LP. Proteome-pI 2.0: Proteome Isoelectric Point Database Update. Nucleic Acids Res. 2021, doi: 10.1093/nar/gkab944 | Contact: Lukasz P. Kozlowski |
