Rhodobacteraceae bacterium TG-679
Taxonomy: cellular organisms; Bacteria; Proteobacteria; Alphaproteobacteria; Rhodobacterales; Rhodobacteraceae; unclassified Rhodobacteraceae
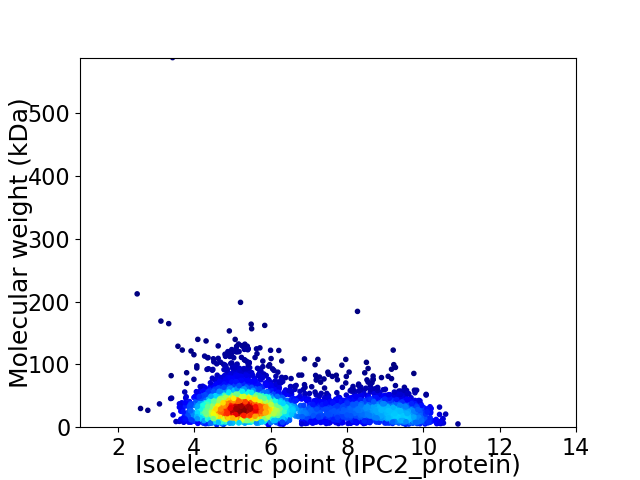
Average proteome isoelectric point is 6.23
Get precalculated fractions of proteins

Virtual 2D-PAGE plot for 3860 proteins (isoelectric point calculated using IPC2_protein)
Get csv file with sequences according to given criteria:
* You can choose from 21 different methods for calculating isoelectric point
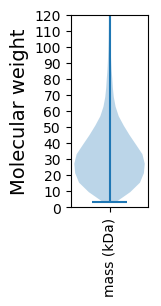
Summary statistics related to proteome-wise predictions


Protein with the lowest isoelectric point:
>tr|A0A2V2LJA1|A0A2V2LJA1_9RHOB Ribosomal protein S12 methylthiotransferase RimO OS=Rhodobacteraceae bacterium TG-679 OX=2072018 GN=rimO PE=3 SV=1
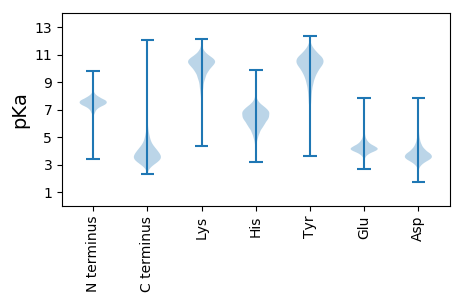
MM1 pKa = 7.2PQVFRR6 pKa = 11.84NACFARR12 pKa = 11.84PNGGIRR18 pKa = 11.84LQLKK22 pKa = 10.18RR23 pKa = 11.84GGPLEE28 pKa = 4.49DD29 pKa = 3.69HH30 pKa = 6.59LKK32 pKa = 10.48SYY34 pKa = 10.26EE35 pKa = 4.05GNHH38 pKa = 5.2MKK40 pKa = 10.49KK41 pKa = 9.79ILLASTALIVSAGFASAEE59 pKa = 4.17VVIGGDD65 pKa = 3.25GYY67 pKa = 10.96MGVAYY72 pKa = 9.85GDD74 pKa = 3.31NGNPIFATTDD84 pKa = 3.04TSADD88 pKa = 3.58QVPAGSGNNFSNYY101 pKa = 10.06SFVYY105 pKa = 10.69DD106 pKa = 4.46LDD108 pKa = 3.8VDD110 pKa = 5.13FKK112 pKa = 11.74ASGTSDD118 pKa = 2.88SGLTFGAAGDD128 pKa = 4.08FDD130 pKa = 6.03DD131 pKa = 6.26LGASQGARR139 pKa = 11.84GWDD142 pKa = 3.13NSIFISGDD150 pKa = 2.94FGTLTMGDD158 pKa = 2.94IDD160 pKa = 3.9GAAEE164 pKa = 3.98NVIGDD169 pKa = 4.11LAGVGLSGLGDD180 pKa = 3.6FNEE183 pKa = 4.42NIFLIGAGAQPAGPVARR200 pKa = 11.84YY201 pKa = 9.76DD202 pKa = 3.71YY203 pKa = 10.78AISGLTLSLGLSDD216 pKa = 5.04DD217 pKa = 3.32SGYY220 pKa = 11.34NIGASYY226 pKa = 8.86ATDD229 pKa = 3.88LFSVGLAYY237 pKa = 10.28EE238 pKa = 4.38DD239 pKa = 3.98VADD242 pKa = 4.44GATVTLFDD250 pKa = 4.29IDD252 pKa = 4.12ALGSTGSTAITATAPNGASQIIGAASVTFANVTLKK287 pKa = 10.81GVYY290 pKa = 9.83GQIDD294 pKa = 3.66VDD296 pKa = 3.87GTTVDD301 pKa = 3.22TFDD304 pKa = 3.35QYY306 pKa = 11.78GVSAAAAFGAASVSAFYY323 pKa = 10.55RR324 pKa = 11.84AVTTDD329 pKa = 3.58FKK331 pKa = 11.68VAGTPDD337 pKa = 3.7NDD339 pKa = 3.24FEE341 pKa = 6.12AYY343 pKa = 9.86GLGVAYY349 pKa = 10.34DD350 pKa = 3.97LGGGLALEE358 pKa = 4.82AGVAQADD365 pKa = 3.69SDD367 pKa = 3.94RR368 pKa = 11.84AANALTVADD377 pKa = 4.74FGVSIDD383 pKa = 3.73FF384 pKa = 4.29
MM1 pKa = 7.2PQVFRR6 pKa = 11.84NACFARR12 pKa = 11.84PNGGIRR18 pKa = 11.84LQLKK22 pKa = 10.18RR23 pKa = 11.84GGPLEE28 pKa = 4.49DD29 pKa = 3.69HH30 pKa = 6.59LKK32 pKa = 10.48SYY34 pKa = 10.26EE35 pKa = 4.05GNHH38 pKa = 5.2MKK40 pKa = 10.49KK41 pKa = 9.79ILLASTALIVSAGFASAEE59 pKa = 4.17VVIGGDD65 pKa = 3.25GYY67 pKa = 10.96MGVAYY72 pKa = 9.85GDD74 pKa = 3.31NGNPIFATTDD84 pKa = 3.04TSADD88 pKa = 3.58QVPAGSGNNFSNYY101 pKa = 10.06SFVYY105 pKa = 10.69DD106 pKa = 4.46LDD108 pKa = 3.8VDD110 pKa = 5.13FKK112 pKa = 11.74ASGTSDD118 pKa = 2.88SGLTFGAAGDD128 pKa = 4.08FDD130 pKa = 6.03DD131 pKa = 6.26LGASQGARR139 pKa = 11.84GWDD142 pKa = 3.13NSIFISGDD150 pKa = 2.94FGTLTMGDD158 pKa = 2.94IDD160 pKa = 3.9GAAEE164 pKa = 3.98NVIGDD169 pKa = 4.11LAGVGLSGLGDD180 pKa = 3.6FNEE183 pKa = 4.42NIFLIGAGAQPAGPVARR200 pKa = 11.84YY201 pKa = 9.76DD202 pKa = 3.71YY203 pKa = 10.78AISGLTLSLGLSDD216 pKa = 5.04DD217 pKa = 3.32SGYY220 pKa = 11.34NIGASYY226 pKa = 8.86ATDD229 pKa = 3.88LFSVGLAYY237 pKa = 10.28EE238 pKa = 4.38DD239 pKa = 3.98VADD242 pKa = 4.44GATVTLFDD250 pKa = 4.29IDD252 pKa = 4.12ALGSTGSTAITATAPNGASQIIGAASVTFANVTLKK287 pKa = 10.81GVYY290 pKa = 9.83GQIDD294 pKa = 3.66VDD296 pKa = 3.87GTTVDD301 pKa = 3.22TFDD304 pKa = 3.35QYY306 pKa = 11.78GVSAAAAFGAASVSAFYY323 pKa = 10.55RR324 pKa = 11.84AVTTDD329 pKa = 3.58FKK331 pKa = 11.68VAGTPDD337 pKa = 3.7NDD339 pKa = 3.24FEE341 pKa = 6.12AYY343 pKa = 9.86GLGVAYY349 pKa = 10.34DD350 pKa = 3.97LGGGLALEE358 pKa = 4.82AGVAQADD365 pKa = 3.69SDD367 pKa = 3.94RR368 pKa = 11.84AANALTVADD377 pKa = 4.74FGVSIDD383 pKa = 3.73FF384 pKa = 4.29
Molecular weight: 38.88 kDa
Isoelectric point according different methods:
Protein with the highest isoelectric point:
>tr|A0A2V2LEW7|A0A2V2LEW7_9RHOB Thioredoxin domain-containing protein OS=Rhodobacteraceae bacterium TG-679 OX=2072018 GN=DKT77_12545 PE=3 SV=1
MM1 pKa = 7.45KK2 pKa = 9.61RR3 pKa = 11.84TFQPSNLVRR12 pKa = 11.84KK13 pKa = 9.18RR14 pKa = 11.84RR15 pKa = 11.84HH16 pKa = 4.42GFRR19 pKa = 11.84ARR21 pKa = 11.84MATKK25 pKa = 10.37AGRR28 pKa = 11.84KK29 pKa = 8.54ILNARR34 pKa = 11.84RR35 pKa = 11.84ARR37 pKa = 11.84GRR39 pKa = 11.84KK40 pKa = 8.43EE41 pKa = 3.72LSAA44 pKa = 5.03
MM1 pKa = 7.45KK2 pKa = 9.61RR3 pKa = 11.84TFQPSNLVRR12 pKa = 11.84KK13 pKa = 9.18RR14 pKa = 11.84RR15 pKa = 11.84HH16 pKa = 4.42GFRR19 pKa = 11.84ARR21 pKa = 11.84MATKK25 pKa = 10.37AGRR28 pKa = 11.84KK29 pKa = 8.54ILNARR34 pKa = 11.84RR35 pKa = 11.84ARR37 pKa = 11.84GRR39 pKa = 11.84KK40 pKa = 8.43EE41 pKa = 3.72LSAA44 pKa = 5.03
Molecular weight: 5.18 kDa
Isoelectric point according different methods:
Peptides (in silico digests for buttom-up proteomics)
Below you can find in silico digests of the whole proteome with Trypsin, Chymotrypsin, Trypsin+LysC, LysN, ArgC proteases suitable for different mass spec machines.| Try ESI |
 |
|---|
| ChTry ESI |
 |
|---|
| ArgC ESI |
 |
|---|
| LysN ESI |
 |
|---|
| TryLysC ESI |
 |
|---|
| Try MALDI |
 |
|---|
| ChTry MALDI |
 |
|---|
| ArgC MALDI |
 |
|---|
| LysN MALDI |
 |
|---|
| TryLysC MALDI |
 |
|---|
| Try LTQ |
 |
|---|
| ChTry LTQ |
 |
|---|
| ArgC LTQ |
 |
|---|
| LysN LTQ |
 |
|---|
| TryLysC LTQ |
 |
|---|
| Try MSlow |
 |
|---|
| ChTry MSlow |
 |
|---|
| ArgC MSlow |
 |
|---|
| LysN MSlow |
 |
|---|
| TryLysC MSlow |
 |
|---|
| Try MShigh |
 |
|---|
| ChTry MShigh |
 |
|---|
| ArgC MShigh |
 |
|---|
| LysN MShigh |
 |
|---|
| TryLysC MShigh |
 |
|---|
General Statistics
Number of major isoforms |
Number of additional isoforms |
Number of all proteins |
Number of amino acids |
Min. Seq. Length |
Max. Seq. Length |
Avg. Seq. Length |
Avg. Mol. Weight |
|---|---|---|---|---|---|---|---|
0 |
1231217 |
34 |
5831 |
319.0 |
34.26 |
Amino acid frequency
Ala |
Cys |
Asp |
Glu |
Phe |
Gly |
His |
Ile |
Lys |
Leu |
|---|---|---|---|---|---|---|---|---|---|
13.568 ± 0.064 | 0.904 ± 0.013 |
6.34 ± 0.042 | 5.19 ± 0.042 |
3.618 ± 0.026 | 9.215 ± 0.045 |
1.98 ± 0.021 | 4.633 ± 0.031 |
2.386 ± 0.032 | 10.258 ± 0.053 |
Met |
Asn |
Gln |
Pro |
Arg |
Ser |
Thr |
Val |
Trp |
Tyr |
|---|---|---|---|---|---|---|---|---|---|
2.603 ± 0.022 | 2.295 ± 0.027 |
5.509 ± 0.03 | 2.958 ± 0.025 |
7.265 ± 0.048 | 4.867 ± 0.031 |
5.598 ± 0.037 | 7.487 ± 0.035 |
1.33 ± 0.018 | 1.994 ± 0.019 |
Most of the basic statistics you can see at this page can be downloaded from this CSV file
Proteome-pI is available under Creative Commons Attribution-NoDerivs license, for more details see here
| Reference: Kozlowski LP. Proteome-pI 2.0: Proteome Isoelectric Point Database Update. Nucleic Acids Res. 2021, doi: 10.1093/nar/gkab944 | Contact: Lukasz P. Kozlowski |
