Mycobacterium ulcerans str. Harvey
Taxonomy: cellular organisms; Bacteria; Terrabacteria group; Actinobacteria; Actinomycetia; Corynebacteriales; Mycobacteriaceae; Mycobacterium; Mycobacterium ulcerans
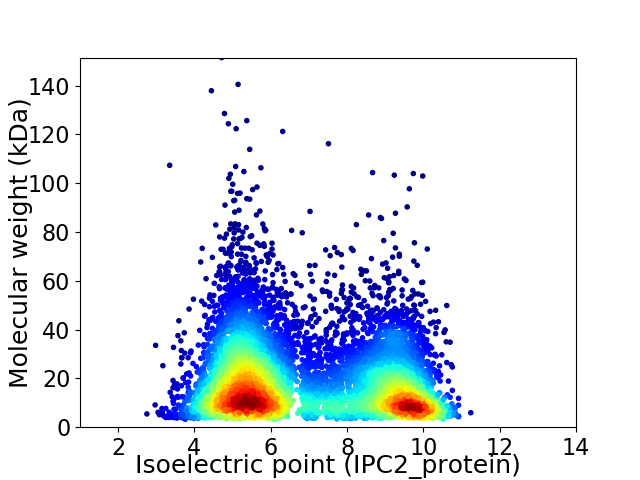
Average proteome isoelectric point is 6.93
Get precalculated fractions of proteins

Virtual 2D-PAGE plot for 9033 proteins (isoelectric point calculated using IPC2_protein)
Get csv file with sequences according to given criteria:
* You can choose from 21 different methods for calculating isoelectric point
Summary statistics related to proteome-wise predictions


Protein with the lowest isoelectric point:
>tr|X8FFK7|X8FFK7_MYCUL Uncharacterized protein OS=Mycobacterium ulcerans str. Harvey OX=1299332 GN=I551_1975 PE=4 SV=1
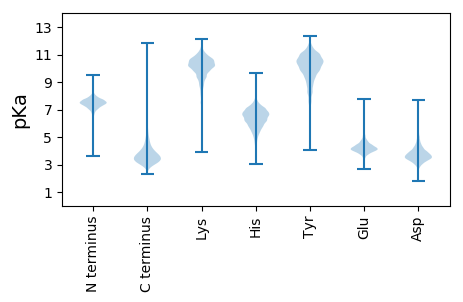
MM1 pKa = 7.51GPFFNGVGGEE11 pKa = 4.04IGVVTSALIGGDD23 pKa = 3.76GAVLLSDD30 pKa = 3.85QIGGITGTLTSLPGLSGLQTLLPGLFPSSGDD61 pKa = 3.4TTTTPAPGGAWQQLFEE77 pKa = 4.37NTSSNLNALGTAWSEE92 pKa = 4.52DD93 pKa = 3.84PFPLLRR99 pKa = 11.84QVIANQQGYY108 pKa = 10.41AYY110 pKa = 9.52TLGQDD115 pKa = 3.83LSLAIQNLPTEE126 pKa = 4.51LAHH129 pKa = 6.85LPEE132 pKa = 5.67NIEE135 pKa = 3.94TGIQGFLAFNPGLYY149 pKa = 9.96AQQFVASTMNDD160 pKa = 2.56FHH162 pKa = 7.15TIGTSLSEE170 pKa = 4.37AGQDD174 pKa = 3.77LQIGLAGFPADD185 pKa = 3.6MQPAYY190 pKa = 10.11EE191 pKa = 4.9AFAAGNYY198 pKa = 9.13NLAVNDD204 pKa = 3.7ATKK207 pKa = 11.06ALLNVFITGFDD218 pKa = 3.47TSNLNDD224 pKa = 3.25IRR226 pKa = 11.84LLGPVADD233 pKa = 5.23LFPILALPGQDD244 pKa = 3.04VQGFSNLLPAGSIPAQMTHH263 pKa = 5.96NLANVLNALTDD274 pKa = 3.65TSISTTISGTLDD286 pKa = 3.38PPALVLDD293 pKa = 4.54ANFGLPLSILFGVAGAPVAGLDD315 pKa = 3.7GLATAGTTIGTGVASGNPFMVVGGLIDD342 pKa = 3.91APAVVLDD349 pKa = 4.0GFLNGEE355 pKa = 4.56TIVDD359 pKa = 3.49MSLPVTFDD367 pKa = 3.53VPVLGPLNIPVVIHH381 pKa = 6.69LPFQGLLVPPHH392 pKa = 7.53PITATVPLEE401 pKa = 3.78ILGVDD406 pKa = 3.36IPINLTLGGTQFGGWCPRR424 pKa = 11.84WW425 pKa = 3.25
MM1 pKa = 7.51GPFFNGVGGEE11 pKa = 4.04IGVVTSALIGGDD23 pKa = 3.76GAVLLSDD30 pKa = 3.85QIGGITGTLTSLPGLSGLQTLLPGLFPSSGDD61 pKa = 3.4TTTTPAPGGAWQQLFEE77 pKa = 4.37NTSSNLNALGTAWSEE92 pKa = 4.52DD93 pKa = 3.84PFPLLRR99 pKa = 11.84QVIANQQGYY108 pKa = 10.41AYY110 pKa = 9.52TLGQDD115 pKa = 3.83LSLAIQNLPTEE126 pKa = 4.51LAHH129 pKa = 6.85LPEE132 pKa = 5.67NIEE135 pKa = 3.94TGIQGFLAFNPGLYY149 pKa = 9.96AQQFVASTMNDD160 pKa = 2.56FHH162 pKa = 7.15TIGTSLSEE170 pKa = 4.37AGQDD174 pKa = 3.77LQIGLAGFPADD185 pKa = 3.6MQPAYY190 pKa = 10.11EE191 pKa = 4.9AFAAGNYY198 pKa = 9.13NLAVNDD204 pKa = 3.7ATKK207 pKa = 11.06ALLNVFITGFDD218 pKa = 3.47TSNLNDD224 pKa = 3.25IRR226 pKa = 11.84LLGPVADD233 pKa = 5.23LFPILALPGQDD244 pKa = 3.04VQGFSNLLPAGSIPAQMTHH263 pKa = 5.96NLANVLNALTDD274 pKa = 3.65TSISTTISGTLDD286 pKa = 3.38PPALVLDD293 pKa = 4.54ANFGLPLSILFGVAGAPVAGLDD315 pKa = 3.7GLATAGTTIGTGVASGNPFMVVGGLIDD342 pKa = 3.91APAVVLDD349 pKa = 4.0GFLNGEE355 pKa = 4.56TIVDD359 pKa = 3.49MSLPVTFDD367 pKa = 3.53VPVLGPLNIPVVIHH381 pKa = 6.69LPFQGLLVPPHH392 pKa = 7.53PITATVPLEE401 pKa = 3.78ILGVDD406 pKa = 3.36IPINLTLGGTQFGGWCPRR424 pKa = 11.84WW425 pKa = 3.25
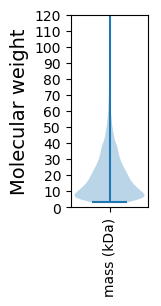
Molecular weight: 43.61 kDa
Isoelectric point according different methods:
Protein with the highest isoelectric point:
>tr|X8FN10|X8FN10_MYCUL Ammonium Transporter family protein OS=Mycobacterium ulcerans str. Harvey OX=1299332 GN=I551_0104 PE=4 SV=1
MM1 pKa = 8.11RR2 pKa = 11.84LRR4 pKa = 11.84KK5 pKa = 9.48ARR7 pKa = 11.84AKK9 pKa = 9.42TVFRR13 pKa = 11.84LRR15 pKa = 11.84SRR17 pKa = 11.84PVRR20 pKa = 11.84HH21 pKa = 6.43PRR23 pKa = 11.84LQKK26 pKa = 9.98MSGRR30 pKa = 11.84LIKK33 pKa = 7.66TTPAPSPRR41 pKa = 11.84RR42 pKa = 11.84WTPWPPASS50 pKa = 3.85
MM1 pKa = 8.11RR2 pKa = 11.84LRR4 pKa = 11.84KK5 pKa = 9.48ARR7 pKa = 11.84AKK9 pKa = 9.42TVFRR13 pKa = 11.84LRR15 pKa = 11.84SRR17 pKa = 11.84PVRR20 pKa = 11.84HH21 pKa = 6.43PRR23 pKa = 11.84LQKK26 pKa = 9.98MSGRR30 pKa = 11.84LIKK33 pKa = 7.66TTPAPSPRR41 pKa = 11.84RR42 pKa = 11.84WTPWPPASS50 pKa = 3.85
Molecular weight: 5.93 kDa
Isoelectric point according different methods:
Peptides (in silico digests for buttom-up proteomics)
Below you can find in silico digests of the whole proteome with Trypsin, Chymotrypsin, Trypsin+LysC, LysN, ArgC proteases suitable for different mass spec machines.| Try ESI |
 |
|---|
| ChTry ESI |
 |
|---|
| ArgC ESI |
 |
|---|
| LysN ESI |
 |
|---|
| TryLysC ESI |
 |
|---|
| Try MALDI |
 |
|---|
| ChTry MALDI |
 |
|---|
| ArgC MALDI |
 |
|---|
| LysN MALDI |
 |
|---|
| TryLysC MALDI |
 |
|---|
| Try LTQ |
 |
|---|
| ChTry LTQ |
 |
|---|
| ArgC LTQ |
 |
|---|
| LysN LTQ |
 |
|---|
| TryLysC LTQ |
 |
|---|
| Try MSlow |
 |
|---|
| ChTry MSlow |
 |
|---|
| ArgC MSlow |
 |
|---|
| LysN MSlow |
 |
|---|
| TryLysC MSlow |
 |
|---|
| Try MShigh |
 |
|---|
| ChTry MShigh |
 |
|---|
| ArgC MShigh |
 |
|---|
| LysN MShigh |
 |
|---|
| TryLysC MShigh |
 |
|---|
General Statistics
Number of major isoforms |
Number of additional isoforms |
Number of all proteins |
Number of amino acids |
Min. Seq. Length |
Max. Seq. Length |
Avg. Seq. Length |
Avg. Mol. Weight |
|---|---|---|---|---|---|---|---|
0 |
1677574 |
31 |
1470 |
185.7 |
19.97 |
Amino acid frequency
Ala |
Cys |
Asp |
Glu |
Phe |
Gly |
His |
Ile |
Lys |
Leu |
|---|---|---|---|---|---|---|---|---|---|
12.97 ± 0.045 | 1.24 ± 0.012 |
5.57 ± 0.023 | 4.595 ± 0.029 |
2.879 ± 0.018 | 8.88 ± 0.043 |
2.346 ± 0.015 | 4.266 ± 0.018 |
2.06 ± 0.02 | 9.421 ± 0.034 |
Met |
Asn |
Gln |
Pro |
Arg |
Ser |
Thr |
Val |
Trp |
Tyr |
|---|---|---|---|---|---|---|---|---|---|
2.268 ± 0.012 | 2.437 ± 0.024 |
6.076 ± 0.024 | 3.129 ± 0.017 |
8.018 ± 0.033 | 6.114 ± 0.021 |
6.151 ± 0.025 | 7.931 ± 0.027 |
1.664 ± 0.013 | 1.984 ± 0.013 |
Most of the basic statistics you can see at this page can be downloaded from this CSV file
Proteome-pI is available under Creative Commons Attribution-NoDerivs license, for more details see here
| Reference: Kozlowski LP. Proteome-pI 2.0: Proteome Isoelectric Point Database Update. Nucleic Acids Res. 2021, doi: 10.1093/nar/gkab944 | Contact: Lukasz P. Kozlowski |
