Prochlorothrix hollandica PCC 9006 = CALU 1027
Taxonomy: cellular organisms; Bacteria; Terrabacteria group; Cyanobacteria/Melainabacteria group; Cyanobacteria; Synechococcales; Prochlorotrichaceae; Prochlorothrix; Prochlorothrix hollandica
Average proteome isoelectric point is 6.05
Get precalculated fractions of proteins

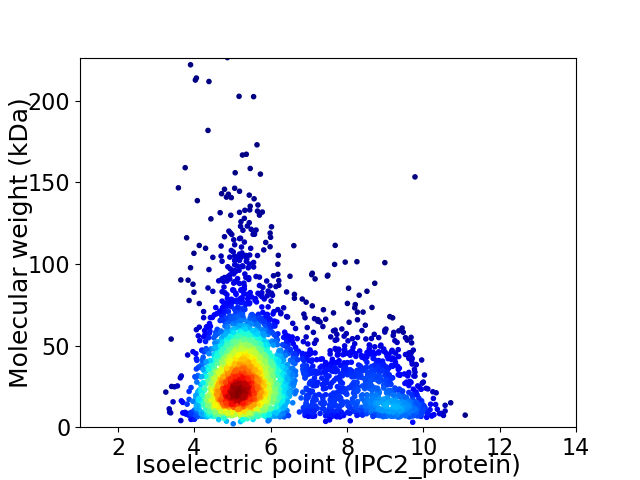
Virtual 2D-PAGE plot for 3617 proteins (isoelectric point calculated using IPC2_protein)
Get csv file with sequences according to given criteria:
* You can choose from 21 different methods for calculating isoelectric point
Summary statistics related to proteome-wise predictions


Protein with the lowest isoelectric point:
>tr|A0A0M2PZ35|A0A0M2PZ35_PROHO CRISPR-associated protein Cmr6 OS=Prochlorothrix hollandica PCC 9006 = CALU 1027 OX=317619 GN=PROH_07105 PE=4 SV=1
MM1 pKa = 7.61SNLIITGVIDD11 pKa = 4.14GPLTGGTPKK20 pKa = 10.61AIEE23 pKa = 4.52LYY25 pKa = 10.46ALNDD29 pKa = 3.36IADD32 pKa = 3.94LSIYY36 pKa = 10.36GIEE39 pKa = 4.0AATNGSASTGVDD51 pKa = 3.82FTLTGSATAGDD62 pKa = 4.48YY63 pKa = 10.51IYY65 pKa = 10.9VASEE69 pKa = 3.99TTQFNAYY76 pKa = 10.12FGFNPTFVNAVANINGDD93 pKa = 3.33DD94 pKa = 4.01TIILFEE100 pKa = 4.68NNSIVDD106 pKa = 3.46VFGEE110 pKa = 4.03IGVDD114 pKa = 3.33GTGRR118 pKa = 11.84PWEE121 pKa = 4.63HH122 pKa = 6.85LDD124 pKa = 2.75GWAYY128 pKa = 10.91RR129 pKa = 11.84NNDD132 pKa = 3.33VDD134 pKa = 3.94PSSTFNASEE143 pKa = 3.98WTFSGVNALDD153 pKa = 4.73DD154 pKa = 4.45DD155 pKa = 4.85ASNVNATATPSWPIGTFTAGGTDD178 pKa = 3.35TTAPTIATLTPVDD191 pKa = 4.08DD192 pKa = 4.14SSNVVVGNNLQVQFSEE208 pKa = 4.29NVQKK212 pKa = 10.25GTGNIVIKK220 pKa = 10.55QSSDD224 pKa = 3.05NAVVEE229 pKa = 4.91TIDD232 pKa = 3.42VTSAQVTVSGSTVTINPTNDD252 pKa = 3.18LANSTGYY259 pKa = 10.5YY260 pKa = 10.17SSPKK264 pKa = 8.13WVVWCAPSGGTPHH277 pKa = 6.99QGFQPSRR284 pKa = 11.84SLQLII289 pKa = 3.97
MM1 pKa = 7.61SNLIITGVIDD11 pKa = 4.14GPLTGGTPKK20 pKa = 10.61AIEE23 pKa = 4.52LYY25 pKa = 10.46ALNDD29 pKa = 3.36IADD32 pKa = 3.94LSIYY36 pKa = 10.36GIEE39 pKa = 4.0AATNGSASTGVDD51 pKa = 3.82FTLTGSATAGDD62 pKa = 4.48YY63 pKa = 10.51IYY65 pKa = 10.9VASEE69 pKa = 3.99TTQFNAYY76 pKa = 10.12FGFNPTFVNAVANINGDD93 pKa = 3.33DD94 pKa = 4.01TIILFEE100 pKa = 4.68NNSIVDD106 pKa = 3.46VFGEE110 pKa = 4.03IGVDD114 pKa = 3.33GTGRR118 pKa = 11.84PWEE121 pKa = 4.63HH122 pKa = 6.85LDD124 pKa = 2.75GWAYY128 pKa = 10.91RR129 pKa = 11.84NNDD132 pKa = 3.33VDD134 pKa = 3.94PSSTFNASEE143 pKa = 3.98WTFSGVNALDD153 pKa = 4.73DD154 pKa = 4.45DD155 pKa = 4.85ASNVNATATPSWPIGTFTAGGTDD178 pKa = 3.35TTAPTIATLTPVDD191 pKa = 4.08DD192 pKa = 4.14SSNVVVGNNLQVQFSEE208 pKa = 4.29NVQKK212 pKa = 10.25GTGNIVIKK220 pKa = 10.55QSSDD224 pKa = 3.05NAVVEE229 pKa = 4.91TIDD232 pKa = 3.42VTSAQVTVSGSTVTINPTNDD252 pKa = 3.18LANSTGYY259 pKa = 10.5YY260 pKa = 10.17SSPKK264 pKa = 8.13WVVWCAPSGGTPHH277 pKa = 6.99QGFQPSRR284 pKa = 11.84SLQLII289 pKa = 3.97
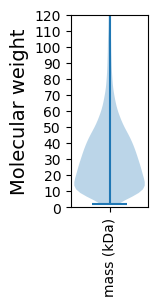
Molecular weight: 30.23 kDa
Isoelectric point according different methods:
Protein with the highest isoelectric point:
>tr|A0A0M2Q252|A0A0M2Q252_PROHO Uncharacterized protein (Fragment) OS=Prochlorothrix hollandica PCC 9006 = CALU 1027 OX=317619 GN=PROH_05270 PE=4 SV=1
MM1 pKa = 7.56AVQIPRR7 pKa = 11.84VPPRR11 pKa = 11.84KK12 pKa = 9.75LPLLVRR18 pKa = 11.84LPLLARR24 pKa = 11.84LPLLARR30 pKa = 11.84LPLPQKK36 pKa = 10.51ALQPLKK42 pKa = 10.66VQAKK46 pKa = 8.51VKK48 pKa = 9.58FARR51 pKa = 11.84VLRR54 pKa = 11.84PLPTGTRR61 pKa = 11.84AMGTNGG67 pKa = 3.25
MM1 pKa = 7.56AVQIPRR7 pKa = 11.84VPPRR11 pKa = 11.84KK12 pKa = 9.75LPLLVRR18 pKa = 11.84LPLLARR24 pKa = 11.84LPLLARR30 pKa = 11.84LPLPQKK36 pKa = 10.51ALQPLKK42 pKa = 10.66VQAKK46 pKa = 8.51VKK48 pKa = 9.58FARR51 pKa = 11.84VLRR54 pKa = 11.84PLPTGTRR61 pKa = 11.84AMGTNGG67 pKa = 3.25
Molecular weight: 7.39 kDa
Isoelectric point according different methods:
Peptides (in silico digests for buttom-up proteomics)
Below you can find in silico digests of the whole proteome with Trypsin, Chymotrypsin, Trypsin+LysC, LysN, ArgC proteases suitable for different mass spec machines.| Try ESI |
 |
|---|
| ChTry ESI |
 |
|---|
| ArgC ESI |
 |
|---|
| LysN ESI |
 |
|---|
| TryLysC ESI |
 |
|---|
| Try MALDI |
 |
|---|
| ChTry MALDI |
 |
|---|
| ArgC MALDI |
 |
|---|
| LysN MALDI |
 |
|---|
| TryLysC MALDI |
 |
|---|
| Try LTQ |
 |
|---|
| ChTry LTQ |
 |
|---|
| ArgC LTQ |
 |
|---|
| LysN LTQ |
 |
|---|
| TryLysC LTQ |
 |
|---|
| Try MSlow |
 |
|---|
| ChTry MSlow |
 |
|---|
| ArgC MSlow |
 |
|---|
| LysN MSlow |
 |
|---|
| TryLysC MSlow |
 |
|---|
| Try MShigh |
 |
|---|
| ChTry MShigh |
 |
|---|
| ArgC MShigh |
 |
|---|
| LysN MShigh |
 |
|---|
| TryLysC MShigh |
 |
|---|
General Statistics
Number of major isoforms |
Number of additional isoforms |
Number of all proteins |
Number of amino acids |
Min. Seq. Length |
Max. Seq. Length |
Avg. Seq. Length |
Avg. Mol. Weight |
|---|---|---|---|---|---|---|---|
1111657 |
20 |
2278 |
307.3 |
33.91 |
Amino acid frequency
Ala |
Cys |
Asp |
Glu |
Phe |
Gly |
His |
Ile |
Lys |
Leu |
|---|---|---|---|---|---|---|---|---|---|
9.106 ± 0.047 | 1.004 ± 0.012 |
5.53 ± 0.028 | 5.436 ± 0.042 |
3.534 ± 0.028 | 7.681 ± 0.056 |
2.141 ± 0.023 | 5.091 ± 0.03 |
3.128 ± 0.04 | 11.81 ± 0.053 |
Met |
Asn |
Gln |
Pro |
Arg |
Ser |
Thr |
Val |
Trp |
Tyr |
|---|---|---|---|---|---|---|---|---|---|
1.834 ± 0.015 | 3.07 ± 0.028 |
5.87 ± 0.049 | 5.922 ± 0.045 |
5.904 ± 0.033 | 5.997 ± 0.037 |
5.705 ± 0.034 | 6.879 ± 0.03 |
1.623 ± 0.022 | 2.735 ± 0.026 |
Most of the basic statistics you can see at this page can be downloaded from this CSV file
Proteome-pI is available under Creative Commons Attribution-NoDerivs license, for more details see here
| Reference: Kozlowski LP. Proteome-pI 2.0: Proteome Isoelectric Point Database Update. Nucleic Acids Res. 2021, doi: 10.1093/nar/gkab944 | Contact: Lukasz P. Kozlowski |
