Balaenoptera acutorostrata scammoni (North Pacific minke whale) (Balaenoptera davidsoni)
Taxonomy: cellular organisms; Eukaryota; Opisthokonta; Metazoa; Eumetazoa; Bilateria; Deuterostomia; Chordata; Craniata; Vertebrata; Gnathostomata; Teleostomi; Euteleostomi; Sarcopterygii; Dipnotetrapodomorpha; Tetrapoda; Amniota; Mammalia; Theria; Eutheria; Boreoeutheria; Laurasiatheria; Artiodactyla; Whippomorpha;
Average proteome isoelectric point is 6.66
Get precalculated fractions of proteins

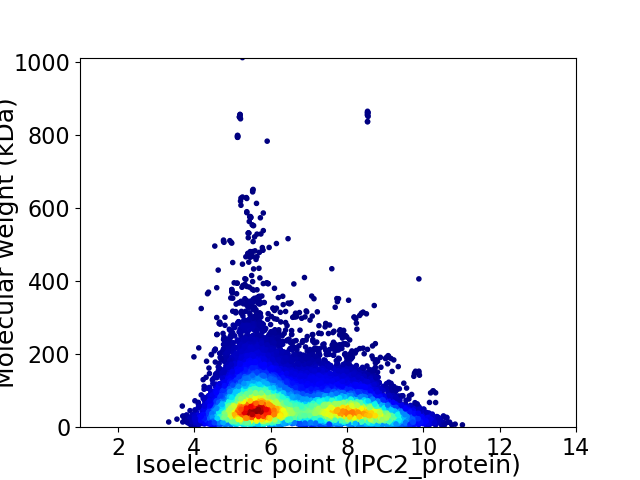
Virtual 2D-PAGE plot for 32130 proteins (isoelectric point calculated using IPC2_protein)
Get csv file with sequences according to given criteria:
* You can choose from 21 different methods for calculating isoelectric point
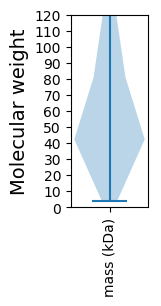
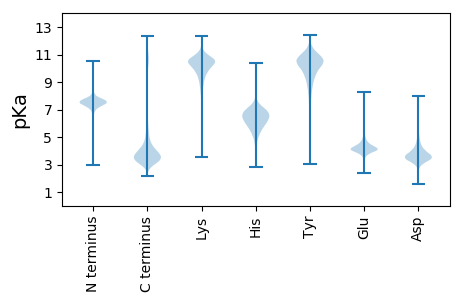
Summary statistics related to proteome-wise predictions


Protein with the lowest isoelectric point:
>tr|A0A384A451|A0A384A451_BALAS paralemmin-3 OS=Balaenoptera acutorostrata scammoni OX=310752 GN=PALM3 PE=4 SV=1
MM1 pKa = 7.33LHH3 pKa = 7.03LPQAWPPAGSCLSSEE18 pKa = 4.56CGPVRR23 pKa = 11.84TSRR26 pKa = 11.84EE27 pKa = 4.03QPVPTQPPRR36 pKa = 11.84QNPPEE41 pKa = 4.61DD42 pKa = 3.8NEE44 pKa = 4.46EE45 pKa = 4.25PPALPPRR52 pKa = 11.84TPEE55 pKa = 3.86GFQMEE60 pKa = 4.58EE61 pKa = 3.88EE62 pKa = 4.29PVYY65 pKa = 10.95EE66 pKa = 4.23EE67 pKa = 4.34APEE70 pKa = 4.23PEE72 pKa = 4.87PEE74 pKa = 4.44PEE76 pKa = 4.35PEE78 pKa = 4.21PEE80 pKa = 4.27PEE82 pKa = 3.79NDD84 pKa = 3.62YY85 pKa = 11.62EE86 pKa = 5.66DD87 pKa = 3.62VGEE90 pKa = 4.24MDD92 pKa = 2.8RR93 pKa = 11.84HH94 pKa = 5.87EE95 pKa = 4.7PDD97 pKa = 3.75EE98 pKa = 4.48EE99 pKa = 4.57PEE101 pKa = 3.93GDD103 pKa = 3.89YY104 pKa = 11.51EE105 pKa = 6.01DD106 pKa = 4.23VLEE109 pKa = 4.64PQDD112 pKa = 3.89PSFSSTLAGSSGCPAGAGAGISAVALYY139 pKa = 9.95DD140 pKa = 3.86YY141 pKa = 10.74QGEE144 pKa = 4.37GSDD147 pKa = 4.64EE148 pKa = 4.09ISFDD152 pKa = 3.81PDD154 pKa = 4.98DD155 pKa = 5.37IITDD159 pKa = 3.27IEE161 pKa = 4.37MVDD164 pKa = 3.5EE165 pKa = 4.67GWWRR169 pKa = 11.84GRR171 pKa = 11.84CHH173 pKa = 5.78GHH175 pKa = 6.85FGLFPANYY183 pKa = 7.78VTLLQQ188 pKa = 4.14
MM1 pKa = 7.33LHH3 pKa = 7.03LPQAWPPAGSCLSSEE18 pKa = 4.56CGPVRR23 pKa = 11.84TSRR26 pKa = 11.84EE27 pKa = 4.03QPVPTQPPRR36 pKa = 11.84QNPPEE41 pKa = 4.61DD42 pKa = 3.8NEE44 pKa = 4.46EE45 pKa = 4.25PPALPPRR52 pKa = 11.84TPEE55 pKa = 3.86GFQMEE60 pKa = 4.58EE61 pKa = 3.88EE62 pKa = 4.29PVYY65 pKa = 10.95EE66 pKa = 4.23EE67 pKa = 4.34APEE70 pKa = 4.23PEE72 pKa = 4.87PEE74 pKa = 4.44PEE76 pKa = 4.35PEE78 pKa = 4.21PEE80 pKa = 4.27PEE82 pKa = 3.79NDD84 pKa = 3.62YY85 pKa = 11.62EE86 pKa = 5.66DD87 pKa = 3.62VGEE90 pKa = 4.24MDD92 pKa = 2.8RR93 pKa = 11.84HH94 pKa = 5.87EE95 pKa = 4.7PDD97 pKa = 3.75EE98 pKa = 4.48EE99 pKa = 4.57PEE101 pKa = 3.93GDD103 pKa = 3.89YY104 pKa = 11.51EE105 pKa = 6.01DD106 pKa = 4.23VLEE109 pKa = 4.64PQDD112 pKa = 3.89PSFSSTLAGSSGCPAGAGAGISAVALYY139 pKa = 9.95DD140 pKa = 3.86YY141 pKa = 10.74QGEE144 pKa = 4.37GSDD147 pKa = 4.64EE148 pKa = 4.09ISFDD152 pKa = 3.81PDD154 pKa = 4.98DD155 pKa = 5.37IITDD159 pKa = 3.27IEE161 pKa = 4.37MVDD164 pKa = 3.5EE165 pKa = 4.67GWWRR169 pKa = 11.84GRR171 pKa = 11.84CHH173 pKa = 5.78GHH175 pKa = 6.85FGLFPANYY183 pKa = 7.78VTLLQQ188 pKa = 4.14
Molecular weight: 20.7 kDa
Isoelectric point according different methods:
Protein with the highest isoelectric point:
>tr|A0A383YVM1|A0A383YVM1_BALAS zinc finger protein GLI4 OS=Balaenoptera acutorostrata scammoni OX=310752 GN=GLI4 PE=4 SV=2
MM1 pKa = 7.57SSHH4 pKa = 5.15KK5 pKa = 8.91TFRR8 pKa = 11.84IKK10 pKa = 10.64RR11 pKa = 11.84FLAKK15 pKa = 9.71KK16 pKa = 9.58QKK18 pKa = 8.69QNRR21 pKa = 11.84PIPQWIRR28 pKa = 11.84MKK30 pKa = 9.89TGNKK34 pKa = 8.61IRR36 pKa = 11.84YY37 pKa = 7.09NSKK40 pKa = 8.3RR41 pKa = 11.84RR42 pKa = 11.84HH43 pKa = 3.95WRR45 pKa = 11.84RR46 pKa = 11.84TKK48 pKa = 10.83LGLL51 pKa = 3.67
MM1 pKa = 7.57SSHH4 pKa = 5.15KK5 pKa = 8.91TFRR8 pKa = 11.84IKK10 pKa = 10.64RR11 pKa = 11.84FLAKK15 pKa = 9.71KK16 pKa = 9.58QKK18 pKa = 8.69QNRR21 pKa = 11.84PIPQWIRR28 pKa = 11.84MKK30 pKa = 9.89TGNKK34 pKa = 8.61IRR36 pKa = 11.84YY37 pKa = 7.09NSKK40 pKa = 8.3RR41 pKa = 11.84RR42 pKa = 11.84HH43 pKa = 3.95WRR45 pKa = 11.84RR46 pKa = 11.84TKK48 pKa = 10.83LGLL51 pKa = 3.67
Molecular weight: 6.41 kDa
Isoelectric point according different methods:
Peptides (in silico digests for buttom-up proteomics)
Below you can find in silico digests of the whole proteome with Trypsin, Chymotrypsin, Trypsin+LysC, LysN, ArgC proteases suitable for different mass spec machines.| Try ESI |
 |
|---|
| ChTry ESI |
 |
|---|
| ArgC ESI |
 |
|---|
| LysN ESI |
 |
|---|
| TryLysC ESI |
 |
|---|
| Try MALDI |
 |
|---|
| ChTry MALDI |
 |
|---|
| ArgC MALDI |
 |
|---|
| LysN MALDI |
 |
|---|
| TryLysC MALDI |
 |
|---|
| Try LTQ |
 |
|---|
| ChTry LTQ |
 |
|---|
| ArgC LTQ |
 |
|---|
| LysN LTQ |
 |
|---|
| TryLysC LTQ |
 |
|---|
| Try MSlow |
 |
|---|
| ChTry MSlow |
 |
|---|
| ArgC MSlow |
 |
|---|
| LysN MSlow |
 |
|---|
| TryLysC MSlow |
 |
|---|
| Try MShigh |
 |
|---|
| ChTry MShigh |
 |
|---|
| ArgC MShigh |
 |
|---|
| LysN MShigh |
 |
|---|
| TryLysC MShigh |
 |
|---|
General Statistics
Number of major isoforms |
Number of additional isoforms |
Number of all proteins |
Number of amino acids |
Min. Seq. Length |
Max. Seq. Length |
Avg. Seq. Length |
Avg. Mol. Weight |
|---|---|---|---|---|---|---|---|
20399175 |
31 |
34461 |
634.9 |
70.74 |
Amino acid frequency
Ala |
Cys |
Asp |
Glu |
Phe |
Gly |
His |
Ile |
Lys |
Leu |
|---|---|---|---|---|---|---|---|---|---|
6.899 ± 0.013 | 2.128 ± 0.01 |
4.893 ± 0.012 | 7.343 ± 0.02 |
3.51 ± 0.01 | 6.389 ± 0.022 |
2.582 ± 0.007 | 4.288 ± 0.011 |
5.894 ± 0.02 | 9.857 ± 0.019 |
Met |
Asn |
Gln |
Pro |
Arg |
Ser |
Thr |
Val |
Trp |
Tyr |
|---|---|---|---|---|---|---|---|---|---|
2.115 ± 0.006 | 3.609 ± 0.01 |
6.243 ± 0.024 | 4.917 ± 0.013 |
5.688 ± 0.011 | 8.478 ± 0.019 |
5.303 ± 0.009 | 6.011 ± 0.011 |
1.18 ± 0.005 | 2.59 ± 0.009 |
Most of the basic statistics you can see at this page can be downloaded from this CSV file
Proteome-pI is available under Creative Commons Attribution-NoDerivs license, for more details see here
| Reference: Kozlowski LP. Proteome-pI 2.0: Proteome Isoelectric Point Database Update. Nucleic Acids Res. 2021, doi: 10.1093/nar/gkab944 | Contact: Lukasz P. Kozlowski |
