Dolosicoccus paucivorans
Taxonomy: cellular organisms; Bacteria; Terrabacteria group; Firmicutes; Bacilli; Lactobacillales; Aerococcaceae; Dolosicoccus
Average proteome isoelectric point is 5.93
Get precalculated fractions of proteins

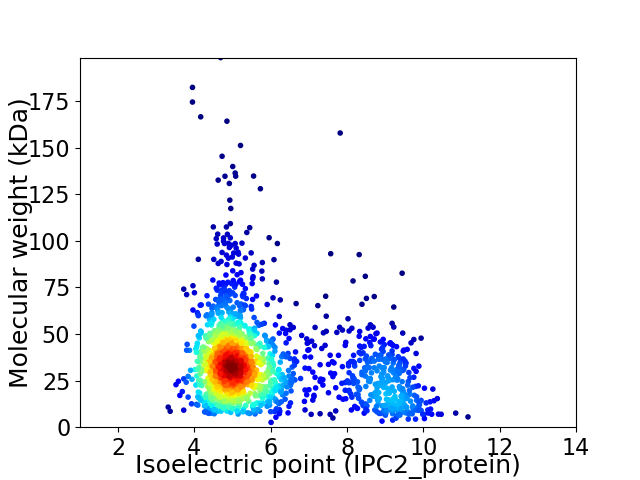
Virtual 2D-PAGE plot for 1609 proteins (isoelectric point calculated using IPC2_protein)
Get csv file with sequences according to given criteria:
* You can choose from 21 different methods for calculating isoelectric point
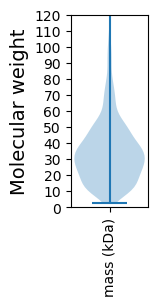
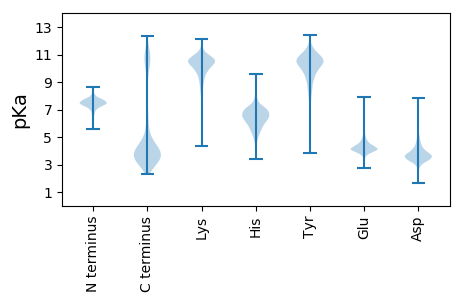
Summary statistics related to proteome-wise predictions


Protein with the lowest isoelectric point:
>tr|A0A2N6SM31|A0A2N6SM31_9LACT Dihydroorotate dehydrogenase OS=Dolosicoccus paucivorans OX=84521 GN=pyrD PE=3 SV=1
MM1 pKa = 7.42SVLKK5 pKa = 10.56KK6 pKa = 10.41IIYY9 pKa = 9.79GLLIGWLGAFSLLTSSAQADD29 pKa = 3.97GVTNIVMTGSDD40 pKa = 3.4RR41 pKa = 11.84QADD44 pKa = 3.76GSGQSDD50 pKa = 3.62STLVVSYY57 pKa = 11.48NEE59 pKa = 3.96GTGQVSLISLPQNLMISIPEE79 pKa = 3.94QGEE82 pKa = 4.17GTLAEE87 pKa = 4.78AYY89 pKa = 10.45SIGGGQLVADD99 pKa = 5.93GIEE102 pKa = 3.96EE103 pKa = 4.2WTDD106 pKa = 3.29ASIDD110 pKa = 3.87DD111 pKa = 4.39YY112 pKa = 11.31LTLDD116 pKa = 3.49MAGVAEE122 pKa = 5.49LIDD125 pKa = 3.81EE126 pKa = 4.51VGGVTVYY133 pKa = 10.59VSEE136 pKa = 4.7SFEE139 pKa = 3.72QDD141 pKa = 2.58GYY143 pKa = 11.54SFQEE147 pKa = 4.26GDD149 pKa = 3.95TLTMDD154 pKa = 4.31GSQALAYY161 pKa = 8.43MRR163 pKa = 11.84HH164 pKa = 6.06LPQEE168 pKa = 4.43GEE170 pKa = 4.08LVSKK174 pKa = 8.32QEE176 pKa = 3.78RR177 pKa = 11.84QAQVIRR183 pKa = 11.84SLGEE187 pKa = 3.61EE188 pKa = 4.08LAGEE192 pKa = 4.34DD193 pKa = 4.16LSAFGYY199 pKa = 10.13IKK201 pKa = 10.67LYY203 pKa = 10.48QNYY206 pKa = 9.64SGYY209 pKa = 10.06IDD211 pKa = 3.81SSLGKK216 pKa = 9.27MEE218 pKa = 4.88MINLVKK224 pKa = 10.36EE225 pKa = 4.73LIQSGSGLSYY235 pKa = 11.18HH236 pKa = 6.66EE237 pKa = 5.7LDD239 pKa = 3.92EE240 pKa = 4.45QTTPDD245 pKa = 3.77QLQMLLQSS253 pKa = 3.97
MM1 pKa = 7.42SVLKK5 pKa = 10.56KK6 pKa = 10.41IIYY9 pKa = 9.79GLLIGWLGAFSLLTSSAQADD29 pKa = 3.97GVTNIVMTGSDD40 pKa = 3.4RR41 pKa = 11.84QADD44 pKa = 3.76GSGQSDD50 pKa = 3.62STLVVSYY57 pKa = 11.48NEE59 pKa = 3.96GTGQVSLISLPQNLMISIPEE79 pKa = 3.94QGEE82 pKa = 4.17GTLAEE87 pKa = 4.78AYY89 pKa = 10.45SIGGGQLVADD99 pKa = 5.93GIEE102 pKa = 3.96EE103 pKa = 4.2WTDD106 pKa = 3.29ASIDD110 pKa = 3.87DD111 pKa = 4.39YY112 pKa = 11.31LTLDD116 pKa = 3.49MAGVAEE122 pKa = 5.49LIDD125 pKa = 3.81EE126 pKa = 4.51VGGVTVYY133 pKa = 10.59VSEE136 pKa = 4.7SFEE139 pKa = 3.72QDD141 pKa = 2.58GYY143 pKa = 11.54SFQEE147 pKa = 4.26GDD149 pKa = 3.95TLTMDD154 pKa = 4.31GSQALAYY161 pKa = 8.43MRR163 pKa = 11.84HH164 pKa = 6.06LPQEE168 pKa = 4.43GEE170 pKa = 4.08LVSKK174 pKa = 8.32QEE176 pKa = 3.78RR177 pKa = 11.84QAQVIRR183 pKa = 11.84SLGEE187 pKa = 3.61EE188 pKa = 4.08LAGEE192 pKa = 4.34DD193 pKa = 4.16LSAFGYY199 pKa = 10.13IKK201 pKa = 10.67LYY203 pKa = 10.48QNYY206 pKa = 9.64SGYY209 pKa = 10.06IDD211 pKa = 3.81SSLGKK216 pKa = 9.27MEE218 pKa = 4.88MINLVKK224 pKa = 10.36EE225 pKa = 4.73LIQSGSGLSYY235 pKa = 11.18HH236 pKa = 6.66EE237 pKa = 5.7LDD239 pKa = 3.92EE240 pKa = 4.45QTTPDD245 pKa = 3.77QLQMLLQSS253 pKa = 3.97
Molecular weight: 27.25 kDa
Isoelectric point according different methods:
Protein with the highest isoelectric point:
>tr|A0A2N6SKT2|A0A2N6SKT2_9LACT 60 kDa chaperonin OS=Dolosicoccus paucivorans OX=84521 GN=groL PE=3 SV=1
MM1 pKa = 7.36KK2 pKa = 9.43RR3 pKa = 11.84TYY5 pKa = 9.7QPKK8 pKa = 8.93KK9 pKa = 9.66RR10 pKa = 11.84KK11 pKa = 9.39RR12 pKa = 11.84QTTHH16 pKa = 5.48GFRR19 pKa = 11.84NRR21 pKa = 11.84MKK23 pKa = 9.56TKK25 pKa = 10.26NGRR28 pKa = 11.84HH29 pKa = 3.75VLARR33 pKa = 11.84RR34 pKa = 11.84RR35 pKa = 11.84RR36 pKa = 11.84KK37 pKa = 8.81GRR39 pKa = 11.84KK40 pKa = 8.91RR41 pKa = 11.84LTVV44 pKa = 3.11
MM1 pKa = 7.36KK2 pKa = 9.43RR3 pKa = 11.84TYY5 pKa = 9.7QPKK8 pKa = 8.93KK9 pKa = 9.66RR10 pKa = 11.84KK11 pKa = 9.39RR12 pKa = 11.84QTTHH16 pKa = 5.48GFRR19 pKa = 11.84NRR21 pKa = 11.84MKK23 pKa = 9.56TKK25 pKa = 10.26NGRR28 pKa = 11.84HH29 pKa = 3.75VLARR33 pKa = 11.84RR34 pKa = 11.84RR35 pKa = 11.84RR36 pKa = 11.84KK37 pKa = 8.81GRR39 pKa = 11.84KK40 pKa = 8.91RR41 pKa = 11.84LTVV44 pKa = 3.11
Molecular weight: 5.52 kDa
Isoelectric point according different methods:
Peptides (in silico digests for buttom-up proteomics)
Below you can find in silico digests of the whole proteome with Trypsin, Chymotrypsin, Trypsin+LysC, LysN, ArgC proteases suitable for different mass spec machines.| Try ESI |
 |
|---|
| ChTry ESI |
 |
|---|
| ArgC ESI |
 |
|---|
| LysN ESI |
 |
|---|
| TryLysC ESI |
 |
|---|
| Try MALDI |
 |
|---|
| ChTry MALDI |
 |
|---|
| ArgC MALDI |
 |
|---|
| LysN MALDI |
 |
|---|
| TryLysC MALDI |
 |
|---|
| Try LTQ |
 |
|---|
| ChTry LTQ |
 |
|---|
| ArgC LTQ |
 |
|---|
| LysN LTQ |
 |
|---|
| TryLysC LTQ |
 |
|---|
| Try MSlow |
 |
|---|
| ChTry MSlow |
 |
|---|
| ArgC MSlow |
 |
|---|
| LysN MSlow |
 |
|---|
| TryLysC MSlow |
 |
|---|
| Try MShigh |
 |
|---|
| ChTry MShigh |
 |
|---|
| ArgC MShigh |
 |
|---|
| LysN MShigh |
 |
|---|
| TryLysC MShigh |
 |
|---|
General Statistics
Number of major isoforms |
Number of additional isoforms |
Number of all proteins |
Number of amino acids |
Min. Seq. Length |
Max. Seq. Length |
Avg. Seq. Length |
Avg. Mol. Weight |
|---|---|---|---|---|---|---|---|
0 |
511702 |
25 |
1795 |
318.0 |
35.83 |
Amino acid frequency
Ala |
Cys |
Asp |
Glu |
Phe |
Gly |
His |
Ile |
Lys |
Leu |
|---|---|---|---|---|---|---|---|---|---|
6.932 ± 0.061 | 0.474 ± 0.015 |
5.888 ± 0.055 | 7.661 ± 0.077 |
4.132 ± 0.041 | 6.422 ± 0.054 |
2.205 ± 0.026 | 7.268 ± 0.051 |
5.864 ± 0.049 | 10.013 ± 0.075 |
Met |
Asn |
Gln |
Pro |
Arg |
Ser |
Thr |
Val |
Trp |
Tyr |
|---|---|---|---|---|---|---|---|---|---|
2.658 ± 0.032 | 4.341 ± 0.037 |
3.771 ± 0.039 | 4.791 ± 0.054 |
4.189 ± 0.047 | 5.698 ± 0.043 |
5.827 ± 0.046 | 7.069 ± 0.05 |
0.926 ± 0.02 | 3.871 ± 0.043 |
Most of the basic statistics you can see at this page can be downloaded from this CSV file
Proteome-pI is available under Creative Commons Attribution-NoDerivs license, for more details see here
| Reference: Kozlowski LP. Proteome-pI 2.0: Proteome Isoelectric Point Database Update. Nucleic Acids Res. 2021, doi: 10.1093/nar/gkab944 | Contact: Lukasz P. Kozlowski |
