Bradyrhizobium sp. STM 3843
Taxonomy: cellular organisms; Bacteria; Proteobacteria; Alphaproteobacteria; Hyphomicrobiales; Bradyrhizobiaceae; Bradyrhizobium; unclassified Bradyrhizobium
Average proteome isoelectric point is 6.89
Get precalculated fractions of proteins

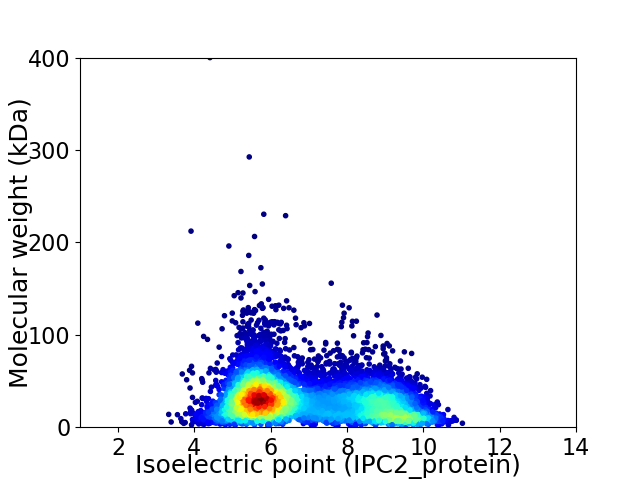
Virtual 2D-PAGE plot for 8201 proteins (isoelectric point calculated using IPC2_protein)
Get csv file with sequences according to given criteria:
* You can choose from 21 different methods for calculating isoelectric point
Summary statistics related to proteome-wise predictions


Protein with the lowest isoelectric point:
>tr|H0TFY1|H0TFY1_9BRAD Uncharacterized protein OS=Bradyrhizobium sp. STM 3843 OX=551947 GN=BRAS3843_1340043 PE=4 SV=1
MM1 pKa = 7.35SLSGALSSAISALNAQSSSLAMISDD26 pKa = 4.88NISNSDD32 pKa = 3.14TTGYY36 pKa = 8.23KK37 pKa = 7.21TTSAMFEE44 pKa = 4.13QLVTASSSSQSYY56 pKa = 9.97SSGGVSVSGRR66 pKa = 11.84SNITQQGLLASTTNATDD83 pKa = 3.24VAIQGSGFFVTANSTTAGGDD103 pKa = 3.15TFYY106 pKa = 10.89TRR108 pKa = 11.84NGAFTTDD115 pKa = 2.95NAGYY119 pKa = 10.62LEE121 pKa = 4.79DD122 pKa = 3.39NGYY125 pKa = 9.87YY126 pKa = 10.4LEE128 pKa = 4.18GWRR131 pKa = 11.84TDD133 pKa = 2.93ASGSITGTSLEE144 pKa = 4.54PINTKK149 pKa = 10.15VALTNGGATTKK160 pKa = 10.48TSISANLPADD170 pKa = 3.81ATSSSTFSSSTTVYY184 pKa = 11.02DD185 pKa = 3.87SLGDD189 pKa = 3.63AHH191 pKa = 6.54TLDD194 pKa = 3.94IKK196 pKa = 8.41WTKK199 pKa = 8.54TAANTWTAQMSSPDD213 pKa = 3.54GTISTTAPASDD224 pKa = 3.85TYY226 pKa = 11.76DD227 pKa = 3.11VTFNNDD233 pKa = 2.41GSLGTVTTAGQSTANPLSITWNNGAATSSITMDD266 pKa = 3.92FGTTGGGTNGLTQLSSGSTTPDD288 pKa = 2.56VSNFNASSDD297 pKa = 3.94GISFGTLSSISVGKK311 pKa = 10.4DD312 pKa = 2.94GIVDD316 pKa = 3.71ATYY319 pKa = 11.42SNGQTIPIYY328 pKa = 10.17KK329 pKa = 9.64IAVATFADD337 pKa = 4.14PNGLVAHH344 pKa = 6.62SGGMYY349 pKa = 9.95TSTATSGDD357 pKa = 3.24ATLQTSGEE365 pKa = 4.15NGAGTIYY372 pKa = 10.61GSEE375 pKa = 4.49LEE377 pKa = 4.51SSTTDD382 pKa = 3.1TTGQFSNMISAQQAYY397 pKa = 9.42SAASQVVTTVNKK409 pKa = 9.84MFDD412 pKa = 3.55TLISSMRR419 pKa = 3.49
MM1 pKa = 7.35SLSGALSSAISALNAQSSSLAMISDD26 pKa = 4.88NISNSDD32 pKa = 3.14TTGYY36 pKa = 8.23KK37 pKa = 7.21TTSAMFEE44 pKa = 4.13QLVTASSSSQSYY56 pKa = 9.97SSGGVSVSGRR66 pKa = 11.84SNITQQGLLASTTNATDD83 pKa = 3.24VAIQGSGFFVTANSTTAGGDD103 pKa = 3.15TFYY106 pKa = 10.89TRR108 pKa = 11.84NGAFTTDD115 pKa = 2.95NAGYY119 pKa = 10.62LEE121 pKa = 4.79DD122 pKa = 3.39NGYY125 pKa = 9.87YY126 pKa = 10.4LEE128 pKa = 4.18GWRR131 pKa = 11.84TDD133 pKa = 2.93ASGSITGTSLEE144 pKa = 4.54PINTKK149 pKa = 10.15VALTNGGATTKK160 pKa = 10.48TSISANLPADD170 pKa = 3.81ATSSSTFSSSTTVYY184 pKa = 11.02DD185 pKa = 3.87SLGDD189 pKa = 3.63AHH191 pKa = 6.54TLDD194 pKa = 3.94IKK196 pKa = 8.41WTKK199 pKa = 8.54TAANTWTAQMSSPDD213 pKa = 3.54GTISTTAPASDD224 pKa = 3.85TYY226 pKa = 11.76DD227 pKa = 3.11VTFNNDD233 pKa = 2.41GSLGTVTTAGQSTANPLSITWNNGAATSSITMDD266 pKa = 3.92FGTTGGGTNGLTQLSSGSTTPDD288 pKa = 2.56VSNFNASSDD297 pKa = 3.94GISFGTLSSISVGKK311 pKa = 10.4DD312 pKa = 2.94GIVDD316 pKa = 3.71ATYY319 pKa = 11.42SNGQTIPIYY328 pKa = 10.17KK329 pKa = 9.64IAVATFADD337 pKa = 4.14PNGLVAHH344 pKa = 6.62SGGMYY349 pKa = 9.95TSTATSGDD357 pKa = 3.24ATLQTSGEE365 pKa = 4.15NGAGTIYY372 pKa = 10.61GSEE375 pKa = 4.49LEE377 pKa = 4.51SSTTDD382 pKa = 3.1TTGQFSNMISAQQAYY397 pKa = 9.42SAASQVVTTVNKK409 pKa = 9.84MFDD412 pKa = 3.55TLISSMRR419 pKa = 3.49
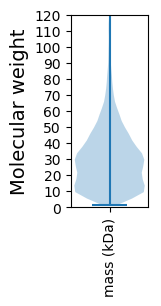
Molecular weight: 42.44 kDa
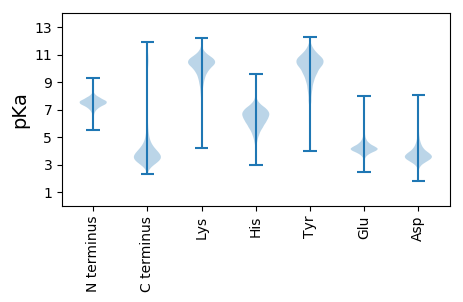
Isoelectric point according different methods:
Protein with the highest isoelectric point:
>tr|H0THB4|H0THB4_9BRAD Putative alkanesulfonate ABC transporter permease protein OS=Bradyrhizobium sp. STM 3843 OX=551947 GN=BRAS3843_1490020 PE=3 SV=1
MM1 pKa = 6.94FRR3 pKa = 11.84VVAHH7 pKa = 6.83PLPLLAKK14 pKa = 10.26LRR16 pKa = 11.84RR17 pKa = 11.84LRR19 pKa = 11.84KK20 pKa = 9.76RR21 pKa = 11.84IAFAHH26 pKa = 6.13SATNGARR33 pKa = 11.84QMVRR37 pKa = 2.96
MM1 pKa = 6.94FRR3 pKa = 11.84VVAHH7 pKa = 6.83PLPLLAKK14 pKa = 10.26LRR16 pKa = 11.84RR17 pKa = 11.84LRR19 pKa = 11.84KK20 pKa = 9.76RR21 pKa = 11.84IAFAHH26 pKa = 6.13SATNGARR33 pKa = 11.84QMVRR37 pKa = 2.96
Molecular weight: 4.28 kDa
Isoelectric point according different methods:
Peptides (in silico digests for buttom-up proteomics)
Below you can find in silico digests of the whole proteome with Trypsin, Chymotrypsin, Trypsin+LysC, LysN, ArgC proteases suitable for different mass spec machines.| Try ESI |
 |
|---|
| ChTry ESI |
 |
|---|
| ArgC ESI |
 |
|---|
| LysN ESI |
 |
|---|
| TryLysC ESI |
 |
|---|
| Try MALDI |
 |
|---|
| ChTry MALDI |
 |
|---|
| ArgC MALDI |
 |
|---|
| LysN MALDI |
 |
|---|
| TryLysC MALDI |
 |
|---|
| Try LTQ |
 |
|---|
| ChTry LTQ |
 |
|---|
| ArgC LTQ |
 |
|---|
| LysN LTQ |
 |
|---|
| TryLysC LTQ |
 |
|---|
| Try MSlow |
 |
|---|
| ChTry MSlow |
 |
|---|
| ArgC MSlow |
 |
|---|
| LysN MSlow |
 |
|---|
| TryLysC MSlow |
 |
|---|
| Try MShigh |
 |
|---|
| ChTry MShigh |
 |
|---|
| ArgC MShigh |
 |
|---|
| LysN MShigh |
 |
|---|
| TryLysC MShigh |
 |
|---|
General Statistics
Number of major isoforms |
Number of additional isoforms |
Number of all proteins |
Number of amino acids |
Min. Seq. Length |
Max. Seq. Length |
Avg. Seq. Length |
Avg. Mol. Weight |
|---|---|---|---|---|---|---|---|
0 |
2401352 |
12 |
4046 |
292.8 |
31.76 |
Amino acid frequency
Ala |
Cys |
Asp |
Glu |
Phe |
Gly |
His |
Ile |
Lys |
Leu |
|---|---|---|---|---|---|---|---|---|---|
12.676 ± 0.04 | 0.922 ± 0.011 |
5.515 ± 0.023 | 5.174 ± 0.027 |
3.724 ± 0.019 | 8.275 ± 0.029 |
2.095 ± 0.016 | 5.287 ± 0.02 |
3.343 ± 0.023 | 10.085 ± 0.034 |
Met |
Asn |
Gln |
Pro |
Arg |
Ser |
Thr |
Val |
Trp |
Tyr |
|---|---|---|---|---|---|---|---|---|---|
2.388 ± 0.012 | 2.678 ± 0.017 |
5.345 ± 0.021 | 3.312 ± 0.014 |
7.101 ± 0.031 | 5.692 ± 0.023 |
5.353 ± 0.022 | 7.423 ± 0.022 |
1.357 ± 0.011 | 2.255 ± 0.014 |
Most of the basic statistics you can see at this page can be downloaded from this CSV file
Proteome-pI is available under Creative Commons Attribution-NoDerivs license, for more details see here
| Reference: Kozlowski LP. Proteome-pI 2.0: Proteome Isoelectric Point Database Update. Nucleic Acids Res. 2021, doi: 10.1093/nar/gkab944 | Contact: Lukasz P. Kozlowski |
