Cohnella sp. OV330
Taxonomy: cellular organisms; Bacteria; Terrabacteria group; Firmicutes; Bacilli; Bacillales; Paenibacillaceae; Cohnella; unclassified Cohnella
Average proteome isoelectric point is 6.34
Get precalculated fractions of proteins

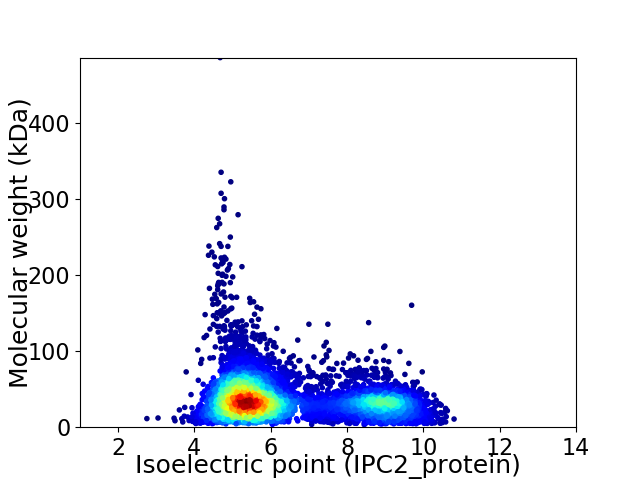
Virtual 2D-PAGE plot for 6192 proteins (isoelectric point calculated using IPC2_protein)
Get csv file with sequences according to given criteria:
* You can choose from 21 different methods for calculating isoelectric point
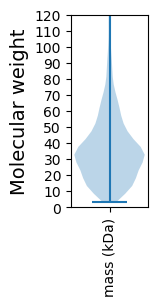
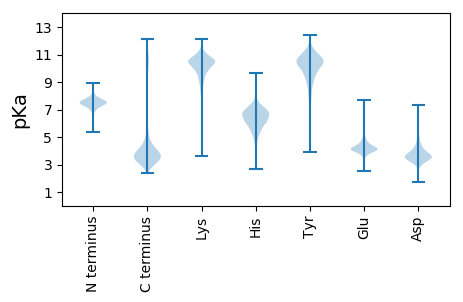
Summary statistics related to proteome-wise predictions


Protein with the lowest isoelectric point:
>tr|A0A1I0VHS7|A0A1I0VHS7_9BACL Dihydrofolate reductase OS=Cohnella sp. OV330 OX=1855288 GN=SAMN05216312_101318 PE=4 SV=1
MM1 pKa = 7.86PYY3 pKa = 9.21STGTVTNTRR12 pKa = 11.84DD13 pKa = 3.14FGTASTNIVLNVRR26 pKa = 11.84NLDD29 pKa = 2.99IALPVSVIVKK39 pKa = 9.51IFASVDD45 pKa = 2.92SDD47 pKa = 3.68NFYY50 pKa = 9.93TAYY53 pKa = 10.4VSSFDD58 pKa = 3.99VPPNAYY64 pKa = 9.81DD65 pKa = 3.23VRR67 pKa = 11.84TFFIAGNVAYY77 pKa = 9.13EE78 pKa = 4.11VQVDD82 pKa = 4.26LFSNSTNALISVYY95 pKa = 10.78GIDD98 pKa = 3.44EE99 pKa = 4.65FGNLVTDD106 pKa = 3.52QRR108 pKa = 11.84FAQNEE113 pKa = 4.01MSFIPTLSPNPP124 pKa = 3.76
MM1 pKa = 7.86PYY3 pKa = 9.21STGTVTNTRR12 pKa = 11.84DD13 pKa = 3.14FGTASTNIVLNVRR26 pKa = 11.84NLDD29 pKa = 2.99IALPVSVIVKK39 pKa = 9.51IFASVDD45 pKa = 2.92SDD47 pKa = 3.68NFYY50 pKa = 9.93TAYY53 pKa = 10.4VSSFDD58 pKa = 3.99VPPNAYY64 pKa = 9.81DD65 pKa = 3.23VRR67 pKa = 11.84TFFIAGNVAYY77 pKa = 9.13EE78 pKa = 4.11VQVDD82 pKa = 4.26LFSNSTNALISVYY95 pKa = 10.78GIDD98 pKa = 3.44EE99 pKa = 4.65FGNLVTDD106 pKa = 3.52QRR108 pKa = 11.84FAQNEE113 pKa = 4.01MSFIPTLSPNPP124 pKa = 3.76
Molecular weight: 13.61 kDa
Isoelectric point according different methods:
Protein with the highest isoelectric point:
>tr|A0A1I0XQ41|A0A1I0XQ41_9BACL Multiple sugar transport system substrate-binding protein OS=Cohnella sp. OV330 OX=1855288 GN=SAMN05216312_10370 PE=4 SV=1
MM1 pKa = 7.23QLEE4 pKa = 4.4SSEE7 pKa = 4.87SEE9 pKa = 3.89QKK11 pKa = 10.73NRR13 pKa = 11.84VLTLSDD19 pKa = 3.18TKK21 pKa = 10.72RR22 pKa = 11.84EE23 pKa = 3.76QRR25 pKa = 11.84RR26 pKa = 11.84QIRR29 pKa = 11.84LRR31 pKa = 11.84LAGRR35 pKa = 11.84ALARR39 pKa = 11.84IHH41 pKa = 6.2IVRR44 pKa = 11.84IGEE47 pKa = 3.97VRR49 pKa = 11.84PALPPAPVEE58 pKa = 4.4LVDD61 pKa = 5.98LSPAGCSFRR70 pKa = 11.84TGLRR74 pKa = 11.84FPVRR78 pKa = 11.84DD79 pKa = 3.47DD80 pKa = 3.11AVYY83 pKa = 10.42RR84 pKa = 11.84MEE86 pKa = 3.97WQLEE90 pKa = 3.96GMTMKK95 pKa = 10.52IKK97 pKa = 10.65GQLVWCRR104 pKa = 11.84EE105 pKa = 3.87DD106 pKa = 3.74EE107 pKa = 4.09YY108 pKa = 11.53GFRR111 pKa = 11.84YY112 pKa = 9.25GVKK115 pKa = 8.76FASGAVEE122 pKa = 4.34TILLVRR128 pKa = 11.84LLNALILKK136 pKa = 8.98ACPHH140 pKa = 6.09QGRR143 pKa = 11.84IHH145 pKa = 7.18RR146 pKa = 11.84IYY148 pKa = 10.6RR149 pKa = 11.84SQLDD153 pKa = 3.35HH154 pKa = 7.17LLRR157 pKa = 11.84RR158 pKa = 4.19
MM1 pKa = 7.23QLEE4 pKa = 4.4SSEE7 pKa = 4.87SEE9 pKa = 3.89QKK11 pKa = 10.73NRR13 pKa = 11.84VLTLSDD19 pKa = 3.18TKK21 pKa = 10.72RR22 pKa = 11.84EE23 pKa = 3.76QRR25 pKa = 11.84RR26 pKa = 11.84QIRR29 pKa = 11.84LRR31 pKa = 11.84LAGRR35 pKa = 11.84ALARR39 pKa = 11.84IHH41 pKa = 6.2IVRR44 pKa = 11.84IGEE47 pKa = 3.97VRR49 pKa = 11.84PALPPAPVEE58 pKa = 4.4LVDD61 pKa = 5.98LSPAGCSFRR70 pKa = 11.84TGLRR74 pKa = 11.84FPVRR78 pKa = 11.84DD79 pKa = 3.47DD80 pKa = 3.11AVYY83 pKa = 10.42RR84 pKa = 11.84MEE86 pKa = 3.97WQLEE90 pKa = 3.96GMTMKK95 pKa = 10.52IKK97 pKa = 10.65GQLVWCRR104 pKa = 11.84EE105 pKa = 3.87DD106 pKa = 3.74EE107 pKa = 4.09YY108 pKa = 11.53GFRR111 pKa = 11.84YY112 pKa = 9.25GVKK115 pKa = 8.76FASGAVEE122 pKa = 4.34TILLVRR128 pKa = 11.84LLNALILKK136 pKa = 8.98ACPHH140 pKa = 6.09QGRR143 pKa = 11.84IHH145 pKa = 7.18RR146 pKa = 11.84IYY148 pKa = 10.6RR149 pKa = 11.84SQLDD153 pKa = 3.35HH154 pKa = 7.17LLRR157 pKa = 11.84RR158 pKa = 4.19
Molecular weight: 18.3 kDa
Isoelectric point according different methods:
Peptides (in silico digests for buttom-up proteomics)
Below you can find in silico digests of the whole proteome with Trypsin, Chymotrypsin, Trypsin+LysC, LysN, ArgC proteases suitable for different mass spec machines.| Try ESI |
 |
|---|
| ChTry ESI |
 |
|---|
| ArgC ESI |
 |
|---|
| LysN ESI |
 |
|---|
| TryLysC ESI |
 |
|---|
| Try MALDI |
 |
|---|
| ChTry MALDI |
 |
|---|
| ArgC MALDI |
 |
|---|
| LysN MALDI |
 |
|---|
| TryLysC MALDI |
 |
|---|
| Try LTQ |
 |
|---|
| ChTry LTQ |
 |
|---|
| ArgC LTQ |
 |
|---|
| LysN LTQ |
 |
|---|
| TryLysC LTQ |
 |
|---|
| Try MSlow |
 |
|---|
| ChTry MSlow |
 |
|---|
| ArgC MSlow |
 |
|---|
| LysN MSlow |
 |
|---|
| TryLysC MSlow |
 |
|---|
| Try MShigh |
 |
|---|
| ChTry MShigh |
 |
|---|
| ArgC MShigh |
 |
|---|
| LysN MShigh |
 |
|---|
| TryLysC MShigh |
 |
|---|
General Statistics
Number of major isoforms |
Number of additional isoforms |
Number of all proteins |
Number of amino acids |
Min. Seq. Length |
Max. Seq. Length |
Avg. Seq. Length |
Avg. Mol. Weight |
|---|---|---|---|---|---|---|---|
0 |
2204178 |
29 |
4665 |
356.0 |
39.15 |
Amino acid frequency
Ala |
Cys |
Asp |
Glu |
Phe |
Gly |
His |
Ile |
Lys |
Leu |
|---|---|---|---|---|---|---|---|---|---|
10.592 ± 0.047 | 0.668 ± 0.011 |
5.545 ± 0.024 | 6.291 ± 0.038 |
3.897 ± 0.023 | 8.247 ± 0.029 |
1.86 ± 0.016 | 5.547 ± 0.026 |
4.459 ± 0.027 | 10.029 ± 0.041 |
Met |
Asn |
Gln |
Pro |
Arg |
Ser |
Thr |
Val |
Trp |
Tyr |
|---|---|---|---|---|---|---|---|---|---|
2.514 ± 0.017 | 3.244 ± 0.026 |
4.414 ± 0.019 | 3.298 ± 0.016 |
5.989 ± 0.044 | 6.173 ± 0.023 |
5.338 ± 0.042 | 7.031 ± 0.028 |
1.419 ± 0.013 | 3.445 ± 0.019 |
Most of the basic statistics you can see at this page can be downloaded from this CSV file
Proteome-pI is available under Creative Commons Attribution-NoDerivs license, for more details see here
| Reference: Kozlowski LP. Proteome-pI 2.0: Proteome Isoelectric Point Database Update. Nucleic Acids Res. 2021, doi: 10.1093/nar/gkab944 | Contact: Lukasz P. Kozlowski |
