cyanobacterium endosymbiont of Rhopalodia gibberula
Taxonomy: cellular organisms; Bacteria; Terrabacteria group; Cyanobacteria/Melainabacteria group; Cyanobacteria; unclassified Cyanobacteria
Average proteome isoelectric point is 6.63
Get precalculated fractions of proteins
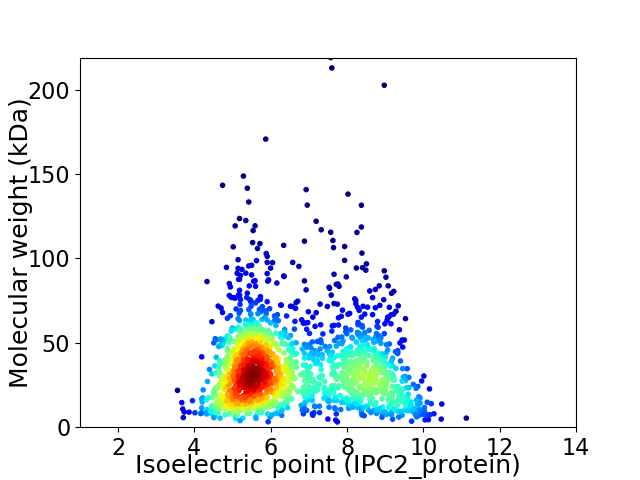
Virtual 2D-PAGE plot for 1671 proteins (isoelectric point calculated using IPC2_protein)
Get csv file with sequences according to given criteria:
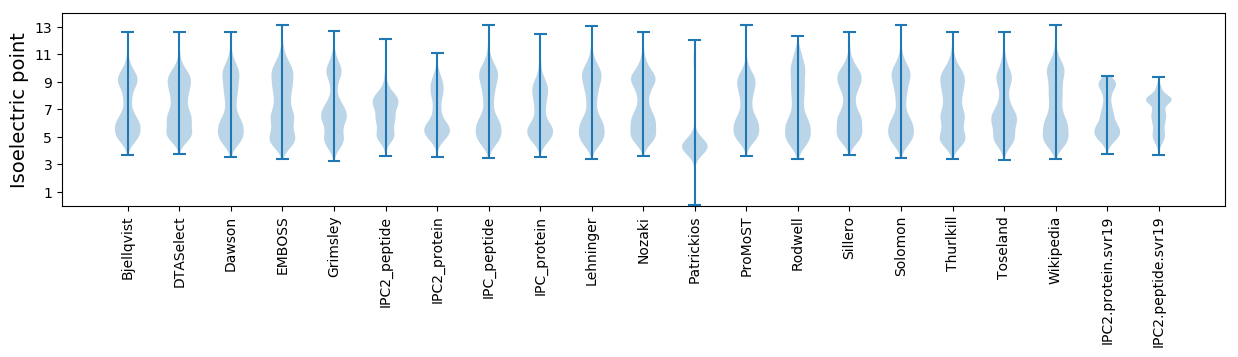
* You can choose from 21 different methods for calculating isoelectric point
Summary statistics related to proteome-wise predictions

Protein with the lowest isoelectric point:
>tr|A0A2Z5SX87|A0A2Z5SX87_9CYAN Uncharacterized protein OS=cyanobacterium endosymbiont of Rhopalodia gibberula OX=1763363 GN=RGRSB_0656 PE=4 SV=1
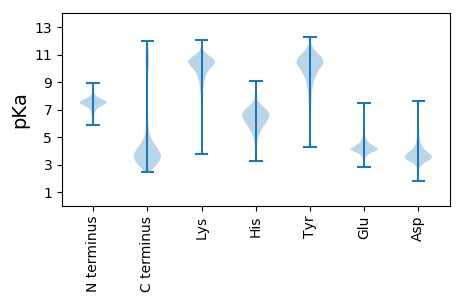
MM1 pKa = 7.67DD2 pKa = 5.76LEE4 pKa = 4.55YY5 pKa = 10.37PDD7 pKa = 4.73DD8 pKa = 4.33LRR10 pKa = 11.84YY11 pKa = 9.97LDD13 pKa = 3.31SHH15 pKa = 6.4EE16 pKa = 4.27YY17 pKa = 9.89IRR19 pKa = 11.84LDD21 pKa = 4.11GEE23 pKa = 3.87IATIGISAYY32 pKa = 10.32AIEE35 pKa = 4.17QLGDD39 pKa = 3.4IVFLEE44 pKa = 4.42LPEE47 pKa = 4.64VGDD50 pKa = 4.11SIEE53 pKa = 3.97VGEE56 pKa = 4.25VFGAIEE62 pKa = 4.2SVKK65 pKa = 10.41AAEE68 pKa = 4.33DD69 pKa = 4.19LYY71 pKa = 10.31PPVSGTVVDD80 pKa = 4.78RR81 pKa = 11.84NEE83 pKa = 4.09QMVEE87 pKa = 4.09TPEE90 pKa = 4.29QIADD94 pKa = 3.74DD95 pKa = 4.61PYY97 pKa = 11.52GDD99 pKa = 3.45GWLLKK104 pKa = 10.72VRR106 pKa = 11.84VEE108 pKa = 4.24NLDD111 pKa = 3.6DD112 pKa = 4.86HH113 pKa = 7.4LDD115 pKa = 3.73NTLSASEE122 pKa = 4.13YY123 pKa = 7.81QAQVEE128 pKa = 4.41GEE130 pKa = 4.17EE131 pKa = 4.17
MM1 pKa = 7.67DD2 pKa = 5.76LEE4 pKa = 4.55YY5 pKa = 10.37PDD7 pKa = 4.73DD8 pKa = 4.33LRR10 pKa = 11.84YY11 pKa = 9.97LDD13 pKa = 3.31SHH15 pKa = 6.4EE16 pKa = 4.27YY17 pKa = 9.89IRR19 pKa = 11.84LDD21 pKa = 4.11GEE23 pKa = 3.87IATIGISAYY32 pKa = 10.32AIEE35 pKa = 4.17QLGDD39 pKa = 3.4IVFLEE44 pKa = 4.42LPEE47 pKa = 4.64VGDD50 pKa = 4.11SIEE53 pKa = 3.97VGEE56 pKa = 4.25VFGAIEE62 pKa = 4.2SVKK65 pKa = 10.41AAEE68 pKa = 4.33DD69 pKa = 4.19LYY71 pKa = 10.31PPVSGTVVDD80 pKa = 4.78RR81 pKa = 11.84NEE83 pKa = 4.09QMVEE87 pKa = 4.09TPEE90 pKa = 4.29QIADD94 pKa = 3.74DD95 pKa = 4.61PYY97 pKa = 11.52GDD99 pKa = 3.45GWLLKK104 pKa = 10.72VRR106 pKa = 11.84VEE108 pKa = 4.24NLDD111 pKa = 3.6DD112 pKa = 4.86HH113 pKa = 7.4LDD115 pKa = 3.73NTLSASEE122 pKa = 4.13YY123 pKa = 7.81QAQVEE128 pKa = 4.41GEE130 pKa = 4.17EE131 pKa = 4.17
Molecular weight: 14.58 kDa
Isoelectric point according different methods:
Protein with the highest isoelectric point:
>tr|A0A2Z5SZW9|A0A2Z5SZW9_9CYAN Lipid II isoglutaminyl synthase (glutamine-hydrolyzing) subunit GatD OS=cyanobacterium endosymbiont of Rhopalodia gibberula OX=1763363 GN=gatD PE=3 SV=1
MM1 pKa = 6.61TQRR4 pKa = 11.84TLGGTNRR11 pKa = 11.84KK12 pKa = 7.61QKK14 pKa = 9.91RR15 pKa = 11.84KK16 pKa = 9.02SGFRR20 pKa = 11.84VRR22 pKa = 11.84MRR24 pKa = 11.84TQNGRR29 pKa = 11.84NVIQARR35 pKa = 11.84RR36 pKa = 11.84KK37 pKa = 8.03KK38 pKa = 9.85GRR40 pKa = 11.84YY41 pKa = 8.24RR42 pKa = 11.84LSVV45 pKa = 3.05
MM1 pKa = 6.61TQRR4 pKa = 11.84TLGGTNRR11 pKa = 11.84KK12 pKa = 7.61QKK14 pKa = 9.91RR15 pKa = 11.84KK16 pKa = 9.02SGFRR20 pKa = 11.84VRR22 pKa = 11.84MRR24 pKa = 11.84TQNGRR29 pKa = 11.84NVIQARR35 pKa = 11.84RR36 pKa = 11.84KK37 pKa = 8.03KK38 pKa = 9.85GRR40 pKa = 11.84YY41 pKa = 8.24RR42 pKa = 11.84LSVV45 pKa = 3.05
Molecular weight: 5.38 kDa
Isoelectric point according different methods:
Peptides (in silico digests for buttom-up proteomics)
Below you can find in silico digests of the whole proteome with Trypsin, Chymotrypsin, Trypsin+LysC, LysN, ArgC proteases suitable for different mass spec machines.| Try ESI |
 |
|---|
| ChTry ESI |
|
|---|
| ArgC ESI |
|
|---|
| LysN ESI |
|
|---|
| TryLysC ESI |
|
|---|
| Try MALDI |
|
|---|
| ChTry MALDI |
|
|---|
| ArgC MALDI |
|
|---|
| LysN MALDI |
|
|---|
| TryLysC MALDI |
|
|---|
| Try LTQ |
|
|---|
| ChTry LTQ |
|
|---|
| ArgC LTQ |
|
|---|
| LysN LTQ |
|
|---|
| TryLysC LTQ |
|
|---|
| Try MSlow |
|
|---|
| ChTry MSlow |
|
|---|
| ArgC MSlow |
|
|---|
| LysN MSlow |
|
|---|
| TryLysC MSlow |
|
|---|
| Try MShigh |
|
|---|
| ChTry MShigh |
|
|---|
| ArgC MShigh |
|
|---|
| LysN MShigh |
|
|---|
| TryLysC MShigh |
|
|---|
General Statistics
Number of major isoforms |
Number of additional isoforms |
Number of all proteins |
Number of amino acids |
Min. Seq. Length |
Max. Seq. Length |
Avg. Seq. Length |
Avg. Mol. Weight |
|---|---|---|---|---|---|---|---|
0 |
545903 |
29 |
1981 |
326.7 |
36.61 |
Amino acid frequency
Ala |
Cys |
Asp |
Glu |
Phe |
Gly |
His |
Ile |
Lys |
Leu |
|---|---|---|---|---|---|---|---|---|---|
6.725 ± 0.052 | 1.088 ± 0.021 |
4.684 ± 0.039 | 6.264 ± 0.062 |
3.972 ± 0.044 | 6.768 ± 0.055 |
1.924 ± 0.031 | 7.716 ± 0.054 |
5.588 ± 0.056 | 11.218 ± 0.054 |
Met |
Asn |
Gln |
Pro |
Arg |
Ser |
Thr |
Val |
Trp |
Tyr |
|---|---|---|---|---|---|---|---|---|---|
1.916 ± 0.024 | 4.381 ± 0.047 |
4.536 ± 0.043 | 4.948 ± 0.051 |
4.992 ± 0.049 | 6.431 ± 0.047 |
5.727 ± 0.037 | 6.6 ± 0.049 |
1.378 ± 0.027 | 3.147 ± 0.035 |
Most of the basic statistics you can see at this page can be downloaded from this CSV file
See this proteome in:

Proteome-pI is available under Creative Commons Attribution-NoDerivs license, for more details see here
| Reference: Kozlowski LP. Proteome-pI 2.0: Proteome Isoelectric Point Database Update. Nucleic Acids Res. 2021, doi: 10.1093/nar/gkab944 | Contact: Lukasz P. Kozlowski |