Mycoplasma sp. Mirounga ES2806-GEN
Taxonomy: cellular organisms; Bacteria; Terrabacteria group; Tenericutes; Mollicutes; Mycoplasmatales; Mycoplasmataceae; Mycoplasma; unclassified Mycoplasma
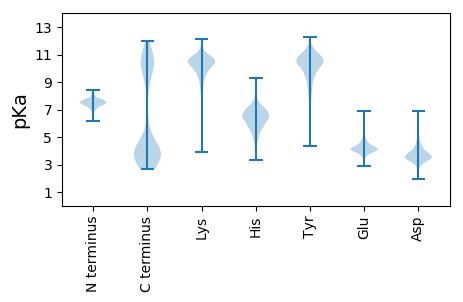
Average proteome isoelectric point is 7.12
Get precalculated fractions of proteins

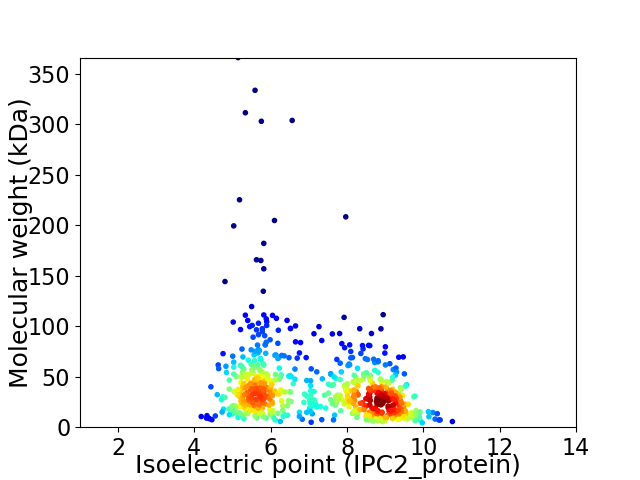
Virtual 2D-PAGE plot for 659 proteins (isoelectric point calculated using IPC2_protein)
Get csv file with sequences according to given criteria:
* You can choose from 21 different methods for calculating isoelectric point
Summary statistics related to proteome-wise predictions


Protein with the lowest isoelectric point:
>tr|A0A6M4JFM1|A0A6M4JFM1_9MOLU S1 RNA-binding domain-containing protein OS=Mycoplasma sp. Mirounga ES2806-GEN OX=754515 GN=HLA87_01720 PE=4 SV=1
MM1 pKa = 7.68IYY3 pKa = 10.45SIDD6 pKa = 3.37LHH8 pKa = 5.99GFSVEE13 pKa = 4.05EE14 pKa = 3.77ATSRR18 pKa = 11.84ILLALQYY25 pKa = 10.97AEE27 pKa = 4.27EE28 pKa = 3.94QDD30 pKa = 3.7YY31 pKa = 10.93DD32 pKa = 3.93YY33 pKa = 11.83LDD35 pKa = 4.71IITGHH40 pKa = 5.93GTGAMKK46 pKa = 9.66VTVEE50 pKa = 3.88NLLNEE55 pKa = 4.16EE56 pKa = 4.31NYY58 pKa = 10.4DD59 pKa = 3.5YY60 pKa = 11.33SIIRR64 pKa = 11.84DD65 pKa = 3.16GCYY68 pKa = 9.26RR69 pKa = 11.84VLIYY73 pKa = 9.48GTFRR77 pKa = 4.25
MM1 pKa = 7.68IYY3 pKa = 10.45SIDD6 pKa = 3.37LHH8 pKa = 5.99GFSVEE13 pKa = 4.05EE14 pKa = 3.77ATSRR18 pKa = 11.84ILLALQYY25 pKa = 10.97AEE27 pKa = 4.27EE28 pKa = 3.94QDD30 pKa = 3.7YY31 pKa = 10.93DD32 pKa = 3.93YY33 pKa = 11.83LDD35 pKa = 4.71IITGHH40 pKa = 5.93GTGAMKK46 pKa = 9.66VTVEE50 pKa = 3.88NLLNEE55 pKa = 4.16EE56 pKa = 4.31NYY58 pKa = 10.4DD59 pKa = 3.5YY60 pKa = 11.33SIIRR64 pKa = 11.84DD65 pKa = 3.16GCYY68 pKa = 9.26RR69 pKa = 11.84VLIYY73 pKa = 9.48GTFRR77 pKa = 4.25
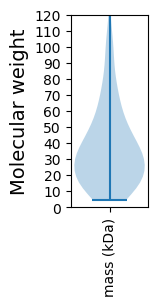
Molecular weight: 8.89 kDa
Isoelectric point according different methods:
Protein with the highest isoelectric point:
>tr|A0A6M4JAZ5|A0A6M4JAZ5_9MOLU Probable GTP-binding protein EngB OS=Mycoplasma sp. Mirounga ES2806-GEN OX=754515 GN=engB PE=3 SV=1
MM1 pKa = 7.52ARR3 pKa = 11.84ILNIEE8 pKa = 3.76IPNNKK13 pKa = 8.93RR14 pKa = 11.84VVVSLTYY21 pKa = 10.34IFGIGPTRR29 pKa = 11.84AKK31 pKa = 9.96EE32 pKa = 3.75ICAKK36 pKa = 10.82ANIDD40 pKa = 3.39EE41 pKa = 4.24NVRR44 pKa = 11.84VKK46 pKa = 10.74DD47 pKa = 3.74LSEE50 pKa = 4.15EE51 pKa = 3.84QLSAIRR57 pKa = 11.84EE58 pKa = 4.17VARR61 pKa = 11.84GYY63 pKa = 7.65QTEE66 pKa = 4.33GDD68 pKa = 3.71LHH70 pKa = 8.28RR71 pKa = 11.84EE72 pKa = 3.37VSLNIKK78 pKa = 10.05RR79 pKa = 11.84LMEE82 pKa = 4.14IKK84 pKa = 10.07CYY86 pKa = 10.37RR87 pKa = 11.84GMRR90 pKa = 11.84HH91 pKa = 6.14RR92 pKa = 11.84KK93 pKa = 7.99GLPVRR98 pKa = 11.84GQSTKK103 pKa = 10.87SNARR107 pKa = 11.84TRR109 pKa = 11.84KK110 pKa = 9.46GPRR113 pKa = 11.84KK114 pKa = 7.66TVAGKK119 pKa = 10.41KK120 pKa = 9.46KK121 pKa = 10.5
MM1 pKa = 7.52ARR3 pKa = 11.84ILNIEE8 pKa = 3.76IPNNKK13 pKa = 8.93RR14 pKa = 11.84VVVSLTYY21 pKa = 10.34IFGIGPTRR29 pKa = 11.84AKK31 pKa = 9.96EE32 pKa = 3.75ICAKK36 pKa = 10.82ANIDD40 pKa = 3.39EE41 pKa = 4.24NVRR44 pKa = 11.84VKK46 pKa = 10.74DD47 pKa = 3.74LSEE50 pKa = 4.15EE51 pKa = 3.84QLSAIRR57 pKa = 11.84EE58 pKa = 4.17VARR61 pKa = 11.84GYY63 pKa = 7.65QTEE66 pKa = 4.33GDD68 pKa = 3.71LHH70 pKa = 8.28RR71 pKa = 11.84EE72 pKa = 3.37VSLNIKK78 pKa = 10.05RR79 pKa = 11.84LMEE82 pKa = 4.14IKK84 pKa = 10.07CYY86 pKa = 10.37RR87 pKa = 11.84GMRR90 pKa = 11.84HH91 pKa = 6.14RR92 pKa = 11.84KK93 pKa = 7.99GLPVRR98 pKa = 11.84GQSTKK103 pKa = 10.87SNARR107 pKa = 11.84TRR109 pKa = 11.84KK110 pKa = 9.46GPRR113 pKa = 11.84KK114 pKa = 7.66TVAGKK119 pKa = 10.41KK120 pKa = 9.46KK121 pKa = 10.5
Molecular weight: 13.76 kDa
Isoelectric point according different methods:
Peptides (in silico digests for buttom-up proteomics)
Below you can find in silico digests of the whole proteome with Trypsin, Chymotrypsin, Trypsin+LysC, LysN, ArgC proteases suitable for different mass spec machines.| Try ESI |
 |
|---|
| ChTry ESI |
 |
|---|
| ArgC ESI |
 |
|---|
| LysN ESI |
 |
|---|
| TryLysC ESI |
 |
|---|
| Try MALDI |
 |
|---|
| ChTry MALDI |
 |
|---|
| ArgC MALDI |
 |
|---|
| LysN MALDI |
 |
|---|
| TryLysC MALDI |
 |
|---|
| Try LTQ |
 |
|---|
| ChTry LTQ |
 |
|---|
| ArgC LTQ |
 |
|---|
| LysN LTQ |
 |
|---|
| TryLysC LTQ |
 |
|---|
| Try MSlow |
 |
|---|
| ChTry MSlow |
 |
|---|
| ArgC MSlow |
 |
|---|
| LysN MSlow |
 |
|---|
| TryLysC MSlow |
 |
|---|
| Try MShigh |
 |
|---|
| ChTry MShigh |
 |
|---|
| ArgC MShigh |
 |
|---|
| LysN MShigh |
 |
|---|
| TryLysC MShigh |
 |
|---|
General Statistics
Number of major isoforms |
Number of additional isoforms |
Number of all proteins |
Number of amino acids |
Min. Seq. Length |
Max. Seq. Length |
Avg. Seq. Length |
Avg. Mol. Weight |
|---|---|---|---|---|---|---|---|
0 |
239779 |
37 |
3270 |
363.9 |
41.5 |
Amino acid frequency
Ala |
Cys |
Asp |
Glu |
Phe |
Gly |
His |
Ile |
Lys |
Leu |
|---|---|---|---|---|---|---|---|---|---|
5.674 ± 0.118 | 0.599 ± 0.024 |
5.821 ± 0.076 | 6.582 ± 0.088 |
5.089 ± 0.09 | 4.781 ± 0.098 |
1.568 ± 0.036 | 9.153 ± 0.096 |
9.867 ± 0.101 | 9.349 ± 0.086 |
Met |
Asn |
Gln |
Pro |
Arg |
Ser |
Thr |
Val |
Trp |
Tyr |
|---|---|---|---|---|---|---|---|---|---|
1.907 ± 0.042 | 7.701 ± 0.127 |
2.737 ± 0.044 | 3.308 ± 0.073 |
2.983 ± 0.069 | 6.623 ± 0.062 |
5.485 ± 0.061 | 5.854 ± 0.06 |
0.954 ± 0.032 | 3.964 ± 0.063 |
Most of the basic statistics you can see at this page can be downloaded from this CSV file
Proteome-pI is available under Creative Commons Attribution-NoDerivs license, for more details see here
| Reference: Kozlowski LP. Proteome-pI 2.0: Proteome Isoelectric Point Database Update. Nucleic Acids Res. 2021, doi: 10.1093/nar/gkab944 | Contact: Lukasz P. Kozlowski |
