Eutrema salsugineum (Saltwater cress) (Sisymbrium salsugineum)
Taxonomy: cellular organisms; Eukaryota; Viridiplantae; Streptophyta; Streptophytina; Embryophyta; Tracheophyta; Euphyllophyta; Spermatophyta; Magnoliopsida; Mesangiospermae; eudicotyledons; Gunneridae; Pentapetalae; rosids; malvids; Brassicales;
Average proteome isoelectric point is 6.78
Get precalculated fractions of proteins

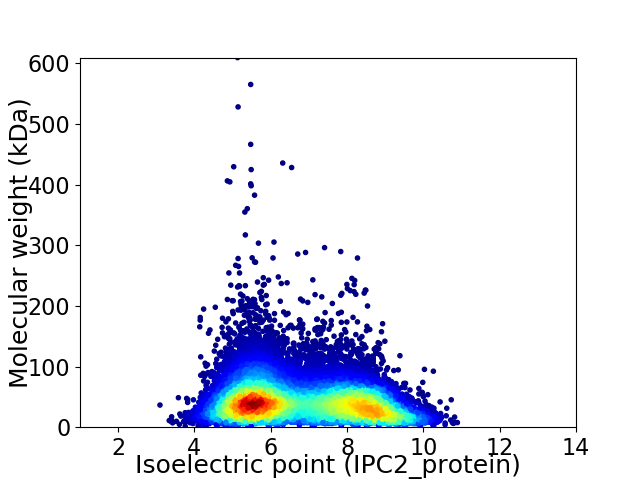
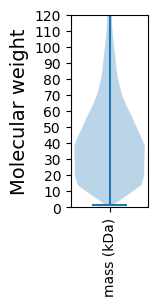
Virtual 2D-PAGE plot for 28349 proteins (isoelectric point calculated using IPC2_protein)
Get csv file with sequences according to given criteria:
* You can choose from 21 different methods for calculating isoelectric point
Summary statistics related to proteome-wise predictions


Protein with the lowest isoelectric point:
>tr|V4LF17|V4LF17_EUTSA Uncharacterized protein OS=Eutrema salsugineum OX=72664 GN=EUTSA_v10012567mg PE=4 SV=1
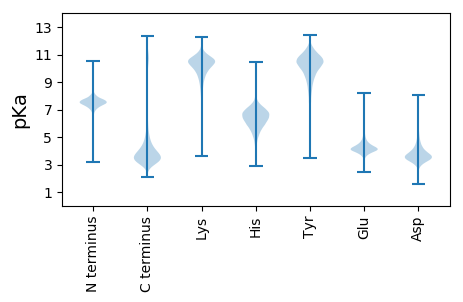
MM1 pKa = 7.87DD2 pKa = 5.91ADD4 pKa = 4.71EE5 pKa = 5.0ISIPSLDD12 pKa = 4.53DD13 pKa = 3.62NSDD16 pKa = 3.32INDD19 pKa = 3.41VMIVAEE25 pKa = 4.49EE26 pKa = 4.49SPDD29 pKa = 3.44SSKK32 pKa = 10.72KK33 pKa = 9.67RR34 pKa = 11.84KK35 pKa = 9.63LGAEE39 pKa = 4.07EE40 pKa = 5.07SDD42 pKa = 3.93LLPLPKK48 pKa = 10.1HH49 pKa = 5.8FCLEE53 pKa = 4.13QAAHH57 pKa = 7.29PDD59 pKa = 3.68SSCPSSDD66 pKa = 3.41IEE68 pKa = 4.76SAEE71 pKa = 3.98CSYY74 pKa = 11.89AMEE77 pKa = 4.15YY78 pKa = 9.66TKK80 pKa = 11.1NSDD83 pKa = 3.64EE84 pKa = 4.43TSSSASGTVASSYY97 pKa = 9.31MSKK100 pKa = 10.62DD101 pKa = 2.99SSYY104 pKa = 10.22STGSSSSGSGHH115 pKa = 5.91ATSSIDD121 pKa = 3.26QCCYY125 pKa = 10.13KK126 pKa = 10.78DD127 pKa = 3.28KK128 pKa = 9.27TQEE131 pKa = 4.08YY132 pKa = 10.03VEE134 pKa = 5.27DD135 pKa = 4.29LSDD138 pKa = 3.99MDD140 pKa = 4.27FLCPEE145 pKa = 4.55LAVEE149 pKa = 5.0DD150 pKa = 4.15LQEE153 pKa = 4.47LLHH156 pKa = 6.46SQDD159 pKa = 3.88SNLKK163 pKa = 9.96GSYY166 pKa = 8.91TLSSAKK172 pKa = 9.67WSVSNQDD179 pKa = 3.33SEE181 pKa = 4.49EE182 pKa = 4.12ATTKK186 pKa = 9.31PTIDD190 pKa = 3.51QEE192 pKa = 4.23FEE194 pKa = 4.55EE195 pKa = 4.76YY196 pKa = 10.61FSTLMMM202 pKa = 5.45
MM1 pKa = 7.87DD2 pKa = 5.91ADD4 pKa = 4.71EE5 pKa = 5.0ISIPSLDD12 pKa = 4.53DD13 pKa = 3.62NSDD16 pKa = 3.32INDD19 pKa = 3.41VMIVAEE25 pKa = 4.49EE26 pKa = 4.49SPDD29 pKa = 3.44SSKK32 pKa = 10.72KK33 pKa = 9.67RR34 pKa = 11.84KK35 pKa = 9.63LGAEE39 pKa = 4.07EE40 pKa = 5.07SDD42 pKa = 3.93LLPLPKK48 pKa = 10.1HH49 pKa = 5.8FCLEE53 pKa = 4.13QAAHH57 pKa = 7.29PDD59 pKa = 3.68SSCPSSDD66 pKa = 3.41IEE68 pKa = 4.76SAEE71 pKa = 3.98CSYY74 pKa = 11.89AMEE77 pKa = 4.15YY78 pKa = 9.66TKK80 pKa = 11.1NSDD83 pKa = 3.64EE84 pKa = 4.43TSSSASGTVASSYY97 pKa = 9.31MSKK100 pKa = 10.62DD101 pKa = 2.99SSYY104 pKa = 10.22STGSSSSGSGHH115 pKa = 5.91ATSSIDD121 pKa = 3.26QCCYY125 pKa = 10.13KK126 pKa = 10.78DD127 pKa = 3.28KK128 pKa = 9.27TQEE131 pKa = 4.08YY132 pKa = 10.03VEE134 pKa = 5.27DD135 pKa = 4.29LSDD138 pKa = 3.99MDD140 pKa = 4.27FLCPEE145 pKa = 4.55LAVEE149 pKa = 5.0DD150 pKa = 4.15LQEE153 pKa = 4.47LLHH156 pKa = 6.46SQDD159 pKa = 3.88SNLKK163 pKa = 9.96GSYY166 pKa = 8.91TLSSAKK172 pKa = 9.67WSVSNQDD179 pKa = 3.33SEE181 pKa = 4.49EE182 pKa = 4.12ATTKK186 pKa = 9.31PTIDD190 pKa = 3.51QEE192 pKa = 4.23FEE194 pKa = 4.55EE195 pKa = 4.76YY196 pKa = 10.61FSTLMMM202 pKa = 5.45
Molecular weight: 22.03 kDa
Isoelectric point according different methods:
Protein with the highest isoelectric point:
>tr|V4MG88|V4MG88_EUTSA Protein SCAR OS=Eutrema salsugineum OX=72664 GN=EUTSA_v10024197mg PE=3 SV=1
MM1 pKa = 7.55ASSKK5 pKa = 10.53VFLVASLLVALMFSSMIASSFAKK28 pKa = 9.09KK29 pKa = 8.69TIKK32 pKa = 10.23PKK34 pKa = 10.44FFRR37 pKa = 11.84HH38 pKa = 4.73HH39 pKa = 6.5HH40 pKa = 5.78FPRR43 pKa = 11.84PGFPQFPRR51 pKa = 11.84PGFPTNPMPFPQFPKK66 pKa = 10.09PGFPQFPGQGLPNNPMPFPQFPRR89 pKa = 11.84PGFPSNPTPGFPQFPGQGFPKK110 pKa = 10.24LPSPLPQIPVSPSFPPATPGSPSGNVLPLPSITAPPTLPTTPISSPP156 pKa = 3.27
MM1 pKa = 7.55ASSKK5 pKa = 10.53VFLVASLLVALMFSSMIASSFAKK28 pKa = 9.09KK29 pKa = 8.69TIKK32 pKa = 10.23PKK34 pKa = 10.44FFRR37 pKa = 11.84HH38 pKa = 4.73HH39 pKa = 6.5HH40 pKa = 5.78FPRR43 pKa = 11.84PGFPQFPRR51 pKa = 11.84PGFPTNPMPFPQFPKK66 pKa = 10.09PGFPQFPGQGLPNNPMPFPQFPRR89 pKa = 11.84PGFPSNPTPGFPQFPGQGFPKK110 pKa = 10.24LPSPLPQIPVSPSFPPATPGSPSGNVLPLPSITAPPTLPTTPISSPP156 pKa = 3.27
Molecular weight: 16.75 kDa
Isoelectric point according different methods:
Peptides (in silico digests for buttom-up proteomics)
Below you can find in silico digests of the whole proteome with Trypsin, Chymotrypsin, Trypsin+LysC, LysN, ArgC proteases suitable for different mass spec machines.| Try ESI |
 |
|---|
| ChTry ESI |
 |
|---|
| ArgC ESI |
 |
|---|
| LysN ESI |
 |
|---|
| TryLysC ESI |
 |
|---|
| Try MALDI |
 |
|---|
| ChTry MALDI |
 |
|---|
| ArgC MALDI |
 |
|---|
| LysN MALDI |
 |
|---|
| TryLysC MALDI |
 |
|---|
| Try LTQ |
 |
|---|
| ChTry LTQ |
 |
|---|
| ArgC LTQ |
 |
|---|
| LysN LTQ |
 |
|---|
| TryLysC LTQ |
 |
|---|
| Try MSlow |
 |
|---|
| ChTry MSlow |
 |
|---|
| ArgC MSlow |
 |
|---|
| LysN MSlow |
 |
|---|
| TryLysC MSlow |
 |
|---|
| Try MShigh |
 |
|---|
| ChTry MShigh |
 |
|---|
| ArgC MShigh |
 |
|---|
| LysN MShigh |
 |
|---|
| TryLysC MShigh |
 |
|---|
General Statistics
Number of major isoforms |
Number of additional isoforms |
Number of all proteins |
Number of amino acids |
Min. Seq. Length |
Max. Seq. Length |
Avg. Seq. Length |
Avg. Mol. Weight |
|---|---|---|---|---|---|---|---|
11549942 |
13 |
5391 |
407.4 |
45.57 |
Amino acid frequency
Ala |
Cys |
Asp |
Glu |
Phe |
Gly |
His |
Ile |
Lys |
Leu |
|---|---|---|---|---|---|---|---|---|---|
6.482 ± 0.014 | 1.847 ± 0.008 |
5.386 ± 0.009 | 6.749 ± 0.017 |
4.282 ± 0.009 | 6.401 ± 0.016 |
2.276 ± 0.006 | 5.242 ± 0.011 |
6.336 ± 0.013 | 9.542 ± 0.016 |
Met |
Asn |
Gln |
Pro |
Arg |
Ser |
Thr |
Val |
Trp |
Tyr |
|---|---|---|---|---|---|---|---|---|---|
2.439 ± 0.005 | 4.338 ± 0.009 |
4.834 ± 0.013 | 3.496 ± 0.011 |
5.514 ± 0.01 | 9.126 ± 0.016 |
5.024 ± 0.01 | 6.619 ± 0.011 |
1.26 ± 0.005 | 2.807 ± 0.008 |
Most of the basic statistics you can see at this page can be downloaded from this CSV file
Proteome-pI is available under Creative Commons Attribution-NoDerivs license, for more details see here
| Reference: Kozlowski LP. Proteome-pI 2.0: Proteome Isoelectric Point Database Update. Nucleic Acids Res. 2021, doi: 10.1093/nar/gkab944 | Contact: Lukasz P. Kozlowski |
