Trichoderma harzianum CBS 226.95
Taxonomy: cellular organisms; Eukaryota; Opisthokonta; Fungi; Dikarya; Ascomycota; saccharomyceta; Pezizomycotina; leotiomyceta; sordariomyceta; Sordariomycetes; Hypocreomycetidae; Hypocreales; Hypocreaceae; Trichoderma; Trichoderma harzianum
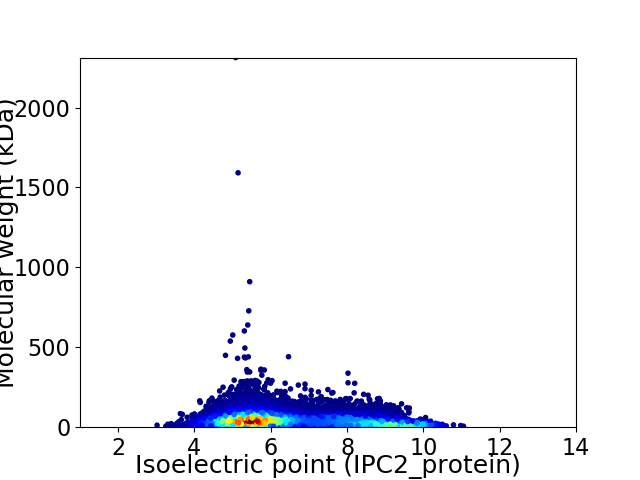
Average proteome isoelectric point is 6.56
Get precalculated fractions of proteins

Virtual 2D-PAGE plot for 14049 proteins (isoelectric point calculated using IPC2_protein)
Get csv file with sequences according to given criteria:
* You can choose from 21 different methods for calculating isoelectric point
Summary statistics related to proteome-wise predictions


Protein with the lowest isoelectric point:
>tr|A0A2T4AT64|A0A2T4AT64_TRIHA Uncharacterized protein OS=Trichoderma harzianum CBS 226.95 OX=983964 GN=M431DRAFT_488926 PE=3 SV=1
MM1 pKa = 7.57KK2 pKa = 10.43LLAITALFIAGALAVPAGSYY22 pKa = 9.13PPPPPPDD29 pKa = 3.3YY30 pKa = 10.97GGYY33 pKa = 9.98SPVPSSSGDD42 pKa = 3.3DD43 pKa = 3.53YY44 pKa = 11.57GYY46 pKa = 11.1VPPTPTPPPPPPPPPPPPSYY66 pKa = 11.09DD67 pKa = 3.28DD68 pKa = 4.21GGDD71 pKa = 3.66YY72 pKa = 10.52EE73 pKa = 5.1PPTDD77 pKa = 4.19GDD79 pKa = 4.1GDD81 pKa = 4.11SSDD84 pKa = 4.55GGDD87 pKa = 5.18DD88 pKa = 5.3GDD90 pKa = 5.61DD91 pKa = 4.02SDD93 pKa = 5.8DD94 pKa = 4.58GSDD97 pKa = 3.51GGDD100 pKa = 3.5GEE102 pKa = 4.76RR103 pKa = 11.84SQTNLCPAVISGIAKK118 pKa = 9.52CCSTNVLDD126 pKa = 6.37LLNLDD131 pKa = 3.86CVSPNKK137 pKa = 9.84EE138 pKa = 3.8PKK140 pKa = 9.73DD141 pKa = 3.55RR142 pKa = 11.84KK143 pKa = 10.41DD144 pKa = 3.31FEE146 pKa = 5.22KK147 pKa = 10.54IFAGMGRR154 pKa = 11.84QATCCTLGLLGLGLLCGHH172 pKa = 7.56
MM1 pKa = 7.57KK2 pKa = 10.43LLAITALFIAGALAVPAGSYY22 pKa = 9.13PPPPPPDD29 pKa = 3.3YY30 pKa = 10.97GGYY33 pKa = 9.98SPVPSSSGDD42 pKa = 3.3DD43 pKa = 3.53YY44 pKa = 11.57GYY46 pKa = 11.1VPPTPTPPPPPPPPPPPPSYY66 pKa = 11.09DD67 pKa = 3.28DD68 pKa = 4.21GGDD71 pKa = 3.66YY72 pKa = 10.52EE73 pKa = 5.1PPTDD77 pKa = 4.19GDD79 pKa = 4.1GDD81 pKa = 4.11SSDD84 pKa = 4.55GGDD87 pKa = 5.18DD88 pKa = 5.3GDD90 pKa = 5.61DD91 pKa = 4.02SDD93 pKa = 5.8DD94 pKa = 4.58GSDD97 pKa = 3.51GGDD100 pKa = 3.5GEE102 pKa = 4.76RR103 pKa = 11.84SQTNLCPAVISGIAKK118 pKa = 9.52CCSTNVLDD126 pKa = 6.37LLNLDD131 pKa = 3.86CVSPNKK137 pKa = 9.84EE138 pKa = 3.8PKK140 pKa = 9.73DD141 pKa = 3.55RR142 pKa = 11.84KK143 pKa = 10.41DD144 pKa = 3.31FEE146 pKa = 5.22KK147 pKa = 10.54IFAGMGRR154 pKa = 11.84QATCCTLGLLGLGLLCGHH172 pKa = 7.56
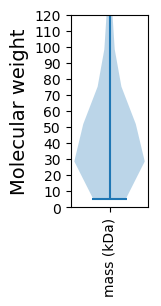
Molecular weight: 17.5 kDa
Isoelectric point according different methods:
Protein with the highest isoelectric point:
>tr|A0A2T4A7B2|A0A2T4A7B2_TRIHA MFS domain-containing protein OS=Trichoderma harzianum CBS 226.95 OX=983964 GN=M431DRAFT_497253 PE=4 SV=1
MM1 pKa = 7.97PFTTHH6 pKa = 6.61RR7 pKa = 11.84RR8 pKa = 11.84HH9 pKa = 5.76HH10 pKa = 6.31HH11 pKa = 4.84TTTTTTARR19 pKa = 11.84PYY21 pKa = 10.08RR22 pKa = 11.84RR23 pKa = 11.84SIFSRR28 pKa = 11.84RR29 pKa = 11.84TPRR32 pKa = 11.84TPRR35 pKa = 11.84VHH37 pKa = 6.38HH38 pKa = 5.48QRR40 pKa = 11.84KK41 pKa = 6.91PTLKK45 pKa = 10.45DD46 pKa = 3.28KK47 pKa = 11.53VSGALLKK54 pKa = 10.95LRR56 pKa = 11.84GSLTRR61 pKa = 11.84RR62 pKa = 11.84PGVKK66 pKa = 9.89AAGTRR71 pKa = 11.84RR72 pKa = 11.84MRR74 pKa = 11.84GTDD77 pKa = 2.81GRR79 pKa = 11.84GSHH82 pKa = 4.94NRR84 pKa = 11.84RR85 pKa = 11.84RR86 pKa = 11.84RR87 pKa = 11.84FLL89 pKa = 3.8
MM1 pKa = 7.97PFTTHH6 pKa = 6.61RR7 pKa = 11.84RR8 pKa = 11.84HH9 pKa = 5.76HH10 pKa = 6.31HH11 pKa = 4.84TTTTTTARR19 pKa = 11.84PYY21 pKa = 10.08RR22 pKa = 11.84RR23 pKa = 11.84SIFSRR28 pKa = 11.84RR29 pKa = 11.84TPRR32 pKa = 11.84TPRR35 pKa = 11.84VHH37 pKa = 6.38HH38 pKa = 5.48QRR40 pKa = 11.84KK41 pKa = 6.91PTLKK45 pKa = 10.45DD46 pKa = 3.28KK47 pKa = 11.53VSGALLKK54 pKa = 10.95LRR56 pKa = 11.84GSLTRR61 pKa = 11.84RR62 pKa = 11.84PGVKK66 pKa = 9.89AAGTRR71 pKa = 11.84RR72 pKa = 11.84MRR74 pKa = 11.84GTDD77 pKa = 2.81GRR79 pKa = 11.84GSHH82 pKa = 4.94NRR84 pKa = 11.84RR85 pKa = 11.84RR86 pKa = 11.84RR87 pKa = 11.84FLL89 pKa = 3.8
Molecular weight: 10.45 kDa
Isoelectric point according different methods:
Peptides (in silico digests for buttom-up proteomics)
Below you can find in silico digests of the whole proteome with Trypsin, Chymotrypsin, Trypsin+LysC, LysN, ArgC proteases suitable for different mass spec machines.| Try ESI |
 |
|---|
| ChTry ESI |
 |
|---|
| ArgC ESI |
 |
|---|
| LysN ESI |
 |
|---|
| TryLysC ESI |
 |
|---|
| Try MALDI |
 |
|---|
| ChTry MALDI |
 |
|---|
| ArgC MALDI |
 |
|---|
| LysN MALDI |
 |
|---|
| TryLysC MALDI |
 |
|---|
| Try LTQ |
 |
|---|
| ChTry LTQ |
 |
|---|
| ArgC LTQ |
 |
|---|
| LysN LTQ |
 |
|---|
| TryLysC LTQ |
 |
|---|
| Try MSlow |
 |
|---|
| ChTry MSlow |
 |
|---|
| ArgC MSlow |
 |
|---|
| LysN MSlow |
 |
|---|
| TryLysC MSlow |
 |
|---|
| Try MShigh |
 |
|---|
| ChTry MShigh |
 |
|---|
| ArgC MShigh |
 |
|---|
| LysN MShigh |
 |
|---|
| TryLysC MShigh |
 |
|---|
General Statistics
Number of major isoforms |
Number of additional isoforms |
Number of all proteins |
Number of amino acids |
Min. Seq. Length |
Max. Seq. Length |
Avg. Seq. Length |
Avg. Mol. Weight |
|---|---|---|---|---|---|---|---|
6187755 |
49 |
20877 |
440.4 |
48.8 |
Amino acid frequency
Ala |
Cys |
Asp |
Glu |
Phe |
Gly |
His |
Ile |
Lys |
Leu |
|---|---|---|---|---|---|---|---|---|---|
8.625 ± 0.018 | 1.345 ± 0.009 |
5.709 ± 0.015 | 6.035 ± 0.02 |
3.838 ± 0.012 | 6.761 ± 0.024 |
2.404 ± 0.009 | 5.214 ± 0.018 |
4.878 ± 0.019 | 9.037 ± 0.025 |
Met |
Asn |
Gln |
Pro |
Arg |
Ser |
Thr |
Val |
Trp |
Tyr |
|---|---|---|---|---|---|---|---|---|---|
2.221 ± 0.008 | 3.739 ± 0.011 |
5.806 ± 0.024 | 4.041 ± 0.016 |
5.91 ± 0.019 | 8.221 ± 0.025 |
5.812 ± 0.013 | 6.071 ± 0.016 |
1.525 ± 0.008 | 2.807 ± 0.01 |
Most of the basic statistics you can see at this page can be downloaded from this CSV file
Proteome-pI is available under Creative Commons Attribution-NoDerivs license, for more details see here
| Reference: Kozlowski LP. Proteome-pI 2.0: Proteome Isoelectric Point Database Update. Nucleic Acids Res. 2021, doi: 10.1093/nar/gkab944 | Contact: Lukasz P. Kozlowski |
