Pseudomonas sp. SST3
Taxonomy: cellular organisms; Bacteria; Proteobacteria; Gammaproteobacteria; Pseudomonadales; Pseudomonadaceae; Pseudomonas; unclassified Pseudomonas
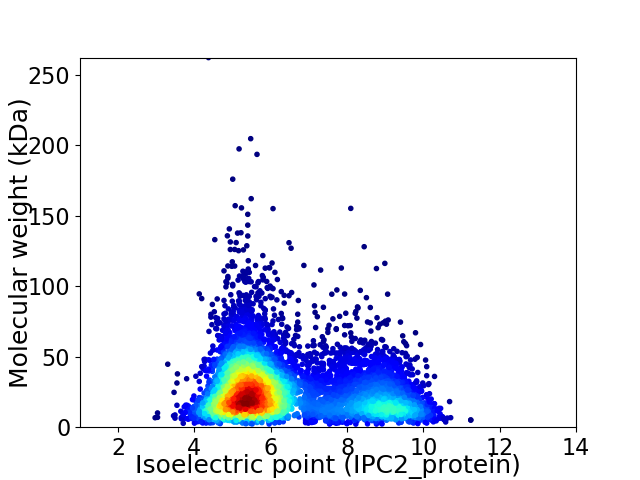
Average proteome isoelectric point is 6.4
Get precalculated fractions of proteins

Virtual 2D-PAGE plot for 6978 proteins (isoelectric point calculated using IPC2_protein)
Get csv file with sequences according to given criteria:
* You can choose from 21 different methods for calculating isoelectric point
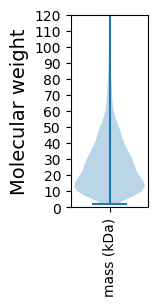
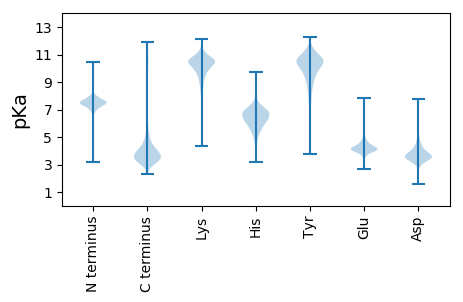
Summary statistics related to proteome-wise predictions


Protein with the lowest isoelectric point:
>tr|A0A658G1C8|A0A658G1C8_9PSED DUF479 domain-containing protein (Fragment) OS=Pseudomonas sp. SST3 OX=2267882 GN=DQ405_47760 PE=4 SV=1
MM1 pKa = 7.32VGGEE5 pKa = 3.69AAGYY9 pKa = 8.21VAHH12 pKa = 7.66AAPQQVRR19 pKa = 11.84IPQSSADD26 pKa = 3.81WLWEE30 pKa = 3.55QDD32 pKa = 3.6VNHH35 pKa = 5.84YY36 pKa = 9.8PEE38 pKa = 3.79WSYY41 pKa = 11.26TMFNKK46 pKa = 8.71KK47 pKa = 7.57TLLALLISAAAANAMAASSEE67 pKa = 4.4AYY69 pKa = 10.25VDD71 pKa = 3.47QDD73 pKa = 4.45GNNQQATVTQEE84 pKa = 4.1GGDD87 pKa = 3.45QFALVFQDD95 pKa = 3.63GEE97 pKa = 4.69GNIGTTYY104 pKa = 10.6QAGSDD109 pKa = 3.8NLSGVYY115 pKa = 8.58QAGNMNVAAVTQSSTNSGSTVVQAGFANKK144 pKa = 10.6AEE146 pKa = 4.22VLQVATNNTSFVNQTGEE163 pKa = 3.93ANEE166 pKa = 4.06AFVTHH171 pKa = 6.81GGGGSHH177 pKa = 7.12FSEE180 pKa = 4.68VTQNGISNDD189 pKa = 3.25ATLKK193 pKa = 10.73QGGNGNWSFITQAGNDD209 pKa = 3.22NKK211 pKa = 11.28ANVGQYY217 pKa = 11.04GNNNLSDD224 pKa = 3.57VSQNGNDD231 pKa = 3.35NVATVSQKK239 pKa = 9.8DD240 pKa = 3.24TGMVYY245 pKa = 10.85ADD247 pKa = 4.0QIGTGNEE254 pKa = 3.97LLVTQGDD261 pKa = 3.99LAVAEE266 pKa = 4.19ILQTGEE272 pKa = 3.97FNDD275 pKa = 4.03VEE277 pKa = 4.33IEE279 pKa = 4.13QKK281 pKa = 11.16GSGNYY286 pKa = 10.54ANVDD290 pKa = 3.05QYY292 pKa = 11.84GQSNNTDD299 pKa = 2.89ITQSGTDD306 pKa = 3.04NDD308 pKa = 4.04AYY310 pKa = 9.75IVQGGVSNMAVAMQFNDD327 pKa = 3.19VV328 pKa = 3.48
MM1 pKa = 7.32VGGEE5 pKa = 3.69AAGYY9 pKa = 8.21VAHH12 pKa = 7.66AAPQQVRR19 pKa = 11.84IPQSSADD26 pKa = 3.81WLWEE30 pKa = 3.55QDD32 pKa = 3.6VNHH35 pKa = 5.84YY36 pKa = 9.8PEE38 pKa = 3.79WSYY41 pKa = 11.26TMFNKK46 pKa = 8.71KK47 pKa = 7.57TLLALLISAAAANAMAASSEE67 pKa = 4.4AYY69 pKa = 10.25VDD71 pKa = 3.47QDD73 pKa = 4.45GNNQQATVTQEE84 pKa = 4.1GGDD87 pKa = 3.45QFALVFQDD95 pKa = 3.63GEE97 pKa = 4.69GNIGTTYY104 pKa = 10.6QAGSDD109 pKa = 3.8NLSGVYY115 pKa = 8.58QAGNMNVAAVTQSSTNSGSTVVQAGFANKK144 pKa = 10.6AEE146 pKa = 4.22VLQVATNNTSFVNQTGEE163 pKa = 3.93ANEE166 pKa = 4.06AFVTHH171 pKa = 6.81GGGGSHH177 pKa = 7.12FSEE180 pKa = 4.68VTQNGISNDD189 pKa = 3.25ATLKK193 pKa = 10.73QGGNGNWSFITQAGNDD209 pKa = 3.22NKK211 pKa = 11.28ANVGQYY217 pKa = 11.04GNNNLSDD224 pKa = 3.57VSQNGNDD231 pKa = 3.35NVATVSQKK239 pKa = 9.8DD240 pKa = 3.24TGMVYY245 pKa = 10.85ADD247 pKa = 4.0QIGTGNEE254 pKa = 3.97LLVTQGDD261 pKa = 3.99LAVAEE266 pKa = 4.19ILQTGEE272 pKa = 3.97FNDD275 pKa = 4.03VEE277 pKa = 4.33IEE279 pKa = 4.13QKK281 pKa = 11.16GSGNYY286 pKa = 10.54ANVDD290 pKa = 3.05QYY292 pKa = 11.84GQSNNTDD299 pKa = 2.89ITQSGTDD306 pKa = 3.04NDD308 pKa = 4.04AYY310 pKa = 9.75IVQGGVSNMAVAMQFNDD327 pKa = 3.19VV328 pKa = 3.48
Molecular weight: 34.35 kDa
Isoelectric point according different methods:
Protein with the highest isoelectric point:
>tr|A0A658G6D3|A0A658G6D3_9PSED Flavin-nucleotide-binding protein OS=Pseudomonas sp. SST3 OX=2267882 GN=DQ405_47200 PE=4 SV=1
MM1 pKa = 7.45KK2 pKa = 9.56RR3 pKa = 11.84TFQPSTIKK11 pKa = 10.52RR12 pKa = 11.84ARR14 pKa = 11.84THH16 pKa = 5.94GFRR19 pKa = 11.84ARR21 pKa = 11.84MATKK25 pKa = 10.16NGRR28 pKa = 11.84AVLSRR33 pKa = 11.84RR34 pKa = 11.84RR35 pKa = 11.84AKK37 pKa = 10.38GRR39 pKa = 11.84ARR41 pKa = 11.84LAVV44 pKa = 3.42
MM1 pKa = 7.45KK2 pKa = 9.56RR3 pKa = 11.84TFQPSTIKK11 pKa = 10.52RR12 pKa = 11.84ARR14 pKa = 11.84THH16 pKa = 5.94GFRR19 pKa = 11.84ARR21 pKa = 11.84MATKK25 pKa = 10.16NGRR28 pKa = 11.84AVLSRR33 pKa = 11.84RR34 pKa = 11.84RR35 pKa = 11.84AKK37 pKa = 10.38GRR39 pKa = 11.84ARR41 pKa = 11.84LAVV44 pKa = 3.42
Molecular weight: 5.07 kDa
Isoelectric point according different methods:
Peptides (in silico digests for buttom-up proteomics)
Below you can find in silico digests of the whole proteome with Trypsin, Chymotrypsin, Trypsin+LysC, LysN, ArgC proteases suitable for different mass spec machines.| Try ESI |
 |
|---|
| ChTry ESI |
 |
|---|
| ArgC ESI |
 |
|---|
| LysN ESI |
 |
|---|
| TryLysC ESI |
 |
|---|
| Try MALDI |
 |
|---|
| ChTry MALDI |
 |
|---|
| ArgC MALDI |
 |
|---|
| LysN MALDI |
 |
|---|
| TryLysC MALDI |
 |
|---|
| Try LTQ |
 |
|---|
| ChTry LTQ |
 |
|---|
| ArgC LTQ |
 |
|---|
| LysN LTQ |
 |
|---|
| TryLysC LTQ |
 |
|---|
| Try MSlow |
 |
|---|
| ChTry MSlow |
 |
|---|
| ArgC MSlow |
 |
|---|
| LysN MSlow |
 |
|---|
| TryLysC MSlow |
 |
|---|
| Try MShigh |
 |
|---|
| ChTry MShigh |
 |
|---|
| ArgC MShigh |
 |
|---|
| LysN MShigh |
 |
|---|
| TryLysC MShigh |
 |
|---|
General Statistics
Number of major isoforms |
Number of additional isoforms |
Number of all proteins |
Number of amino acids |
Min. Seq. Length |
Max. Seq. Length |
Avg. Seq. Length |
Avg. Mol. Weight |
|---|---|---|---|---|---|---|---|
0 |
1805302 |
20 |
2393 |
258.7 |
28.45 |
Amino acid frequency
Ala |
Cys |
Asp |
Glu |
Phe |
Gly |
His |
Ile |
Lys |
Leu |
|---|---|---|---|---|---|---|---|---|---|
10.813 ± 0.036 | 1.046 ± 0.011 |
5.364 ± 0.025 | 6.013 ± 0.031 |
3.669 ± 0.02 | 7.885 ± 0.029 |
2.305 ± 0.016 | 4.914 ± 0.021 |
3.412 ± 0.023 | 11.629 ± 0.044 |
Met |
Asn |
Gln |
Pro |
Arg |
Ser |
Thr |
Val |
Trp |
Tyr |
|---|---|---|---|---|---|---|---|---|---|
2.45 ± 0.016 | 2.956 ± 0.018 |
4.823 ± 0.022 | 4.428 ± 0.025 |
6.655 ± 0.031 | 5.777 ± 0.021 |
4.862 ± 0.02 | 7.034 ± 0.027 |
1.439 ± 0.016 | 2.526 ± 0.016 |
Most of the basic statistics you can see at this page can be downloaded from this CSV file
Proteome-pI is available under Creative Commons Attribution-NoDerivs license, for more details see here
| Reference: Kozlowski LP. Proteome-pI 2.0: Proteome Isoelectric Point Database Update. Nucleic Acids Res. 2021, doi: 10.1093/nar/gkab944 | Contact: Lukasz P. Kozlowski |
