Aneurinibacillus soli
Taxonomy: cellular organisms; Bacteria; Terrabacteria group; Firmicutes; Bacilli; Bacillales; Paenibacillaceae; Aneurinibacillus group; Aneurinibacillus
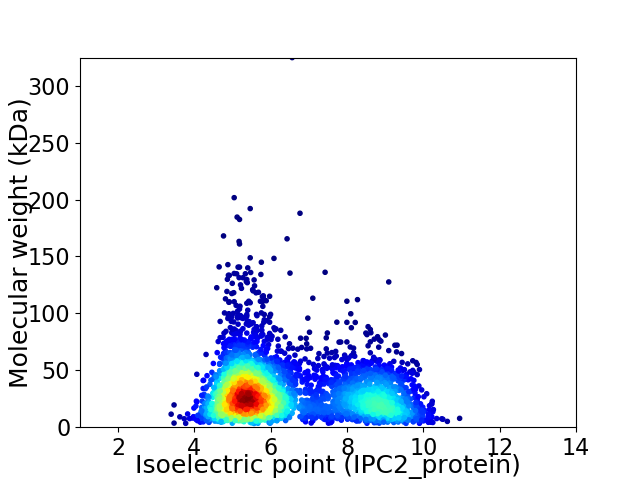
Average proteome isoelectric point is 6.45
Get precalculated fractions of proteins

Virtual 2D-PAGE plot for 3962 proteins (isoelectric point calculated using IPC2_protein)
Get csv file with sequences according to given criteria:
* You can choose from 21 different methods for calculating isoelectric point
Summary statistics related to proteome-wise predictions


Protein with the lowest isoelectric point:
>tr|A0A0U4WKJ6|A0A0U4WKJ6_9BACL Putative prophage phiRv2 integrase OS=Aneurinibacillus soli OX=1500254 GN=CB4_03179 PE=4 SV=1
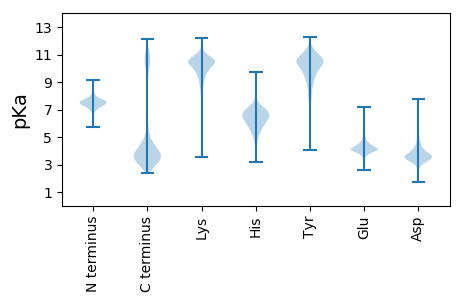
MM1 pKa = 7.01KK2 pKa = 9.93TYY4 pKa = 10.71VDD6 pKa = 4.44KK7 pKa = 10.15DD8 pKa = 3.43TCIACGACGATAPDD22 pKa = 3.44VFDD25 pKa = 4.87YY26 pKa = 11.17DD27 pKa = 4.98DD28 pKa = 4.59EE29 pKa = 5.6GLAFNKK35 pKa = 9.8IDD37 pKa = 4.4DD38 pKa = 4.29NANTAEE44 pKa = 4.37IPDD47 pKa = 3.92VLHH50 pKa = 7.71DD51 pKa = 4.37DD52 pKa = 3.67VRR54 pKa = 11.84DD55 pKa = 3.66AAEE58 pKa = 4.44GCPTDD63 pKa = 3.83SIKK66 pKa = 10.82VEE68 pKa = 4.13EE69 pKa = 4.22
MM1 pKa = 7.01KK2 pKa = 9.93TYY4 pKa = 10.71VDD6 pKa = 4.44KK7 pKa = 10.15DD8 pKa = 3.43TCIACGACGATAPDD22 pKa = 3.44VFDD25 pKa = 4.87YY26 pKa = 11.17DD27 pKa = 4.98DD28 pKa = 4.59EE29 pKa = 5.6GLAFNKK35 pKa = 9.8IDD37 pKa = 4.4DD38 pKa = 4.29NANTAEE44 pKa = 4.37IPDD47 pKa = 3.92VLHH50 pKa = 7.71DD51 pKa = 4.37DD52 pKa = 3.67VRR54 pKa = 11.84DD55 pKa = 3.66AAEE58 pKa = 4.44GCPTDD63 pKa = 3.83SIKK66 pKa = 10.82VEE68 pKa = 4.13EE69 pKa = 4.22
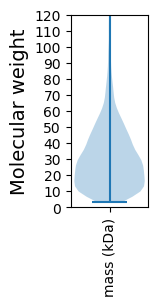
Molecular weight: 7.4 kDa
Isoelectric point according different methods:
Protein with the highest isoelectric point:
>tr|A0A0U5B795|A0A0U5B795_9BACL Uncharacterized protein OS=Aneurinibacillus soli OX=1500254 GN=CB4_03466 PE=4 SV=1
MM1 pKa = 7.34NLLSCFYY8 pKa = 10.93FGFCKK13 pKa = 9.41STRR16 pKa = 11.84RR17 pKa = 11.84SGGGRR22 pKa = 11.84EE23 pKa = 3.85EE24 pKa = 4.1RR25 pKa = 11.84SRR27 pKa = 11.84SLRR30 pKa = 11.84YY31 pKa = 8.81AWQGRR36 pKa = 11.84VDD38 pKa = 4.86CPLQEE43 pKa = 4.78PGEE46 pKa = 4.3LACKK50 pKa = 10.28RR51 pKa = 11.84GPTMLFHH58 pKa = 6.98RR59 pKa = 11.84RR60 pKa = 11.84VAGKK64 pKa = 10.41SPFAGLLPLGNKK76 pKa = 8.0RR77 pKa = 11.84TGALLLLSSLLPTMFRR93 pKa = 11.84FKK95 pKa = 10.81KK96 pKa = 9.24EE97 pKa = 3.86QNNLWGEE104 pKa = 4.74AIQDD108 pKa = 3.17VRR110 pKa = 11.84LIVICPNLVRR120 pKa = 11.84SEE122 pKa = 3.6IRR124 pKa = 11.84RR125 pKa = 11.84GNGTPVRR132 pKa = 11.84ATQRR136 pKa = 11.84KK137 pKa = 8.16GAGEE141 pKa = 4.01QILPTMLLLKK151 pKa = 10.28YY152 pKa = 10.3IEE154 pKa = 5.58GFLLWAVRR162 pKa = 11.84LAPGADD168 pKa = 3.14SLNSRR173 pKa = 11.84EE174 pKa = 4.44SVPKK178 pKa = 10.55
MM1 pKa = 7.34NLLSCFYY8 pKa = 10.93FGFCKK13 pKa = 9.41STRR16 pKa = 11.84RR17 pKa = 11.84SGGGRR22 pKa = 11.84EE23 pKa = 3.85EE24 pKa = 4.1RR25 pKa = 11.84SRR27 pKa = 11.84SLRR30 pKa = 11.84YY31 pKa = 8.81AWQGRR36 pKa = 11.84VDD38 pKa = 4.86CPLQEE43 pKa = 4.78PGEE46 pKa = 4.3LACKK50 pKa = 10.28RR51 pKa = 11.84GPTMLFHH58 pKa = 6.98RR59 pKa = 11.84RR60 pKa = 11.84VAGKK64 pKa = 10.41SPFAGLLPLGNKK76 pKa = 8.0RR77 pKa = 11.84TGALLLLSSLLPTMFRR93 pKa = 11.84FKK95 pKa = 10.81KK96 pKa = 9.24EE97 pKa = 3.86QNNLWGEE104 pKa = 4.74AIQDD108 pKa = 3.17VRR110 pKa = 11.84LIVICPNLVRR120 pKa = 11.84SEE122 pKa = 3.6IRR124 pKa = 11.84RR125 pKa = 11.84GNGTPVRR132 pKa = 11.84ATQRR136 pKa = 11.84KK137 pKa = 8.16GAGEE141 pKa = 4.01QILPTMLLLKK151 pKa = 10.28YY152 pKa = 10.3IEE154 pKa = 5.58GFLLWAVRR162 pKa = 11.84LAPGADD168 pKa = 3.14SLNSRR173 pKa = 11.84EE174 pKa = 4.44SVPKK178 pKa = 10.55
Molecular weight: 19.95 kDa
Isoelectric point according different methods:
Peptides (in silico digests for buttom-up proteomics)
Below you can find in silico digests of the whole proteome with Trypsin, Chymotrypsin, Trypsin+LysC, LysN, ArgC proteases suitable for different mass spec machines.| Try ESI |
 |
|---|
| ChTry ESI |
 |
|---|
| ArgC ESI |
 |
|---|
| LysN ESI |
 |
|---|
| TryLysC ESI |
 |
|---|
| Try MALDI |
 |
|---|
| ChTry MALDI |
 |
|---|
| ArgC MALDI |
 |
|---|
| LysN MALDI |
 |
|---|
| TryLysC MALDI |
 |
|---|
| Try LTQ |
 |
|---|
| ChTry LTQ |
 |
|---|
| ArgC LTQ |
 |
|---|
| LysN LTQ |
 |
|---|
| TryLysC LTQ |
 |
|---|
| Try MSlow |
 |
|---|
| ChTry MSlow |
 |
|---|
| ArgC MSlow |
 |
|---|
| LysN MSlow |
 |
|---|
| TryLysC MSlow |
 |
|---|
| Try MShigh |
 |
|---|
| ChTry MShigh |
 |
|---|
| ArgC MShigh |
 |
|---|
| LysN MShigh |
 |
|---|
| TryLysC MShigh |
 |
|---|
General Statistics
Number of major isoforms |
Number of additional isoforms |
Number of all proteins |
Number of amino acids |
Min. Seq. Length |
Max. Seq. Length |
Avg. Seq. Length |
Avg. Mol. Weight |
|---|---|---|---|---|---|---|---|
0 |
1158177 |
29 |
2902 |
292.3 |
32.61 |
Amino acid frequency
Ala |
Cys |
Asp |
Glu |
Phe |
Gly |
His |
Ile |
Lys |
Leu |
|---|---|---|---|---|---|---|---|---|---|
8.235 ± 0.049 | 0.867 ± 0.012 |
4.943 ± 0.028 | 7.08 ± 0.049 |
3.96 ± 0.028 | 7.143 ± 0.037 |
2.186 ± 0.018 | 6.975 ± 0.035 |
5.731 ± 0.039 | 9.554 ± 0.05 |
Met |
Asn |
Gln |
Pro |
Arg |
Ser |
Thr |
Val |
Trp |
Tyr |
|---|---|---|---|---|---|---|---|---|---|
2.946 ± 0.021 | 3.721 ± 0.03 |
3.85 ± 0.026 | 4.091 ± 0.024 |
5.136 ± 0.036 | 5.831 ± 0.034 |
5.821 ± 0.04 | 7.543 ± 0.033 |
1.048 ± 0.014 | 3.34 ± 0.023 |
Most of the basic statistics you can see at this page can be downloaded from this CSV file
Proteome-pI is available under Creative Commons Attribution-NoDerivs license, for more details see here
| Reference: Kozlowski LP. Proteome-pI 2.0: Proteome Isoelectric Point Database Update. Nucleic Acids Res. 2021, doi: 10.1093/nar/gkab944 | Contact: Lukasz P. Kozlowski |
