Lactobacillus oryzae JCM 18671
Taxonomy: cellular organisms; Bacteria; Terrabacteria group; Firmicutes; Bacilli; Lactobacillales; Lactobacillaceae; Secundilactobacillus; Secundilactobacillus oryzae
Average proteome isoelectric point is 6.44
Get precalculated fractions of proteins

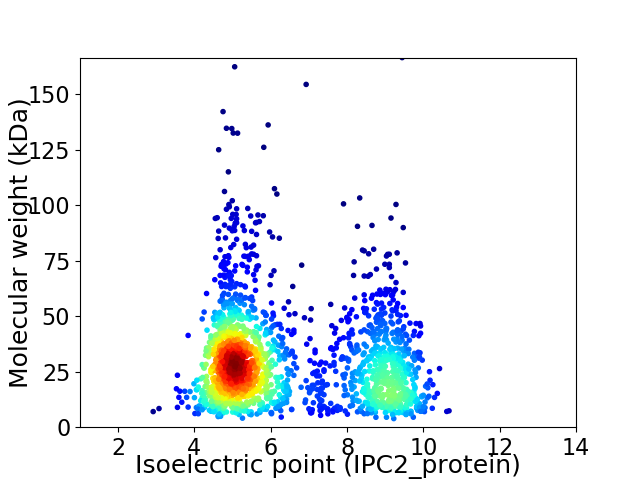
Virtual 2D-PAGE plot for 1890 proteins (isoelectric point calculated using IPC2_protein)
Get csv file with sequences according to given criteria:
* You can choose from 21 different methods for calculating isoelectric point
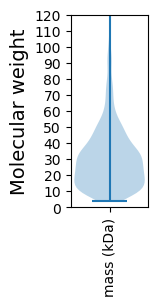
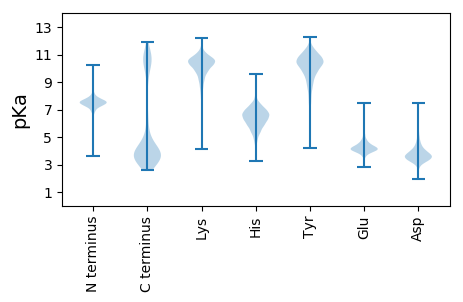
Summary statistics related to proteome-wise predictions


Protein with the lowest isoelectric point:
>tr|A0A081BJ18|A0A081BJ18_9LACO DEAD-box ATP-dependent RNA helicase CshB OS=Lactobacillus oryzae JCM 18671 OX=1291743 GN=cshB PE=3 SV=1
MM1 pKa = 7.05VNYY4 pKa = 9.69YY5 pKa = 10.32NKK7 pKa = 10.38SEE9 pKa = 4.15GPHH12 pKa = 5.31MSEE15 pKa = 4.4EE16 pKa = 4.21NQQITLVDD24 pKa = 3.42EE25 pKa = 5.21DD26 pKa = 4.59GNEE29 pKa = 3.81EE30 pKa = 4.17LYY32 pKa = 10.88EE33 pKa = 3.94VLFTFKK39 pKa = 10.94SPDD42 pKa = 3.33YY43 pKa = 8.9GKK45 pKa = 10.66SYY47 pKa = 11.08ILMYY51 pKa = 10.08PAGKK55 pKa = 10.34ADD57 pKa = 3.99DD58 pKa = 4.43EE59 pKa = 4.5EE60 pKa = 5.12VDD62 pKa = 3.24IQAYY66 pKa = 7.74QLPDD70 pKa = 3.54KK71 pKa = 10.48DD72 pKa = 5.31DD73 pKa = 4.17PANPSGGDD81 pKa = 3.64LLPIEE86 pKa = 5.34SDD88 pKa = 3.84EE89 pKa = 4.12EE90 pKa = 4.04WDD92 pKa = 3.66MVEE95 pKa = 5.11SMLNTFLNGGGTDD108 pKa = 5.29AFDD111 pKa = 4.03QDD113 pKa = 3.02WGDD116 pKa = 3.57PEE118 pKa = 4.2KK119 pKa = 11.17
MM1 pKa = 7.05VNYY4 pKa = 9.69YY5 pKa = 10.32NKK7 pKa = 10.38SEE9 pKa = 4.15GPHH12 pKa = 5.31MSEE15 pKa = 4.4EE16 pKa = 4.21NQQITLVDD24 pKa = 3.42EE25 pKa = 5.21DD26 pKa = 4.59GNEE29 pKa = 3.81EE30 pKa = 4.17LYY32 pKa = 10.88EE33 pKa = 3.94VLFTFKK39 pKa = 10.94SPDD42 pKa = 3.33YY43 pKa = 8.9GKK45 pKa = 10.66SYY47 pKa = 11.08ILMYY51 pKa = 10.08PAGKK55 pKa = 10.34ADD57 pKa = 3.99DD58 pKa = 4.43EE59 pKa = 4.5EE60 pKa = 5.12VDD62 pKa = 3.24IQAYY66 pKa = 7.74QLPDD70 pKa = 3.54KK71 pKa = 10.48DD72 pKa = 5.31DD73 pKa = 4.17PANPSGGDD81 pKa = 3.64LLPIEE86 pKa = 5.34SDD88 pKa = 3.84EE89 pKa = 4.12EE90 pKa = 4.04WDD92 pKa = 3.66MVEE95 pKa = 5.11SMLNTFLNGGGTDD108 pKa = 5.29AFDD111 pKa = 4.03QDD113 pKa = 3.02WGDD116 pKa = 3.57PEE118 pKa = 4.2KK119 pKa = 11.17
Molecular weight: 13.46 kDa
Isoelectric point according different methods:
Protein with the highest isoelectric point:
>tr|A0A081BIH9|A0A081BIH9_9LACO Transport permease protein OS=Lactobacillus oryzae JCM 18671 OX=1291743 GN=LOSG293_130360 PE=3 SV=1
MM1 pKa = 7.4NNQPNTYY8 pKa = 7.0VTKK11 pKa = 9.97PVFVFGFPIVMAIFQALMCIINDD34 pKa = 3.43TRR36 pKa = 11.84TKK38 pKa = 10.49DD39 pKa = 3.37TVDD42 pKa = 3.54PSLTAVFKK50 pKa = 11.11SIVPFLSNLLYY61 pKa = 10.44TVTILFALGHH71 pKa = 6.2LVNIRR76 pKa = 11.84SVAMIALGLISLLVGGFSWNRR97 pKa = 11.84RR98 pKa = 11.84LVSEE102 pKa = 4.39KK103 pKa = 10.1TSAANAIAIKK113 pKa = 10.07RR114 pKa = 11.84ANHH117 pKa = 5.74LVVLSLIVSGLLMLGSVFLPASYY140 pKa = 10.52SVAAIGVFIVLVLLSAWQLTRR161 pKa = 11.84VRR163 pKa = 11.84NRR165 pKa = 11.84EE166 pKa = 3.68
MM1 pKa = 7.4NNQPNTYY8 pKa = 7.0VTKK11 pKa = 9.97PVFVFGFPIVMAIFQALMCIINDD34 pKa = 3.43TRR36 pKa = 11.84TKK38 pKa = 10.49DD39 pKa = 3.37TVDD42 pKa = 3.54PSLTAVFKK50 pKa = 11.11SIVPFLSNLLYY61 pKa = 10.44TVTILFALGHH71 pKa = 6.2LVNIRR76 pKa = 11.84SVAMIALGLISLLVGGFSWNRR97 pKa = 11.84RR98 pKa = 11.84LVSEE102 pKa = 4.39KK103 pKa = 10.1TSAANAIAIKK113 pKa = 10.07RR114 pKa = 11.84ANHH117 pKa = 5.74LVVLSLIVSGLLMLGSVFLPASYY140 pKa = 10.52SVAAIGVFIVLVLLSAWQLTRR161 pKa = 11.84VRR163 pKa = 11.84NRR165 pKa = 11.84EE166 pKa = 3.68
Molecular weight: 18.12 kDa
Isoelectric point according different methods:
Peptides (in silico digests for buttom-up proteomics)
Below you can find in silico digests of the whole proteome with Trypsin, Chymotrypsin, Trypsin+LysC, LysN, ArgC proteases suitable for different mass spec machines.| Try ESI |
 |
|---|
| ChTry ESI |
 |
|---|
| ArgC ESI |
 |
|---|
| LysN ESI |
 |
|---|
| TryLysC ESI |
 |
|---|
| Try MALDI |
 |
|---|
| ChTry MALDI |
 |
|---|
| ArgC MALDI |
 |
|---|
| LysN MALDI |
 |
|---|
| TryLysC MALDI |
 |
|---|
| Try LTQ |
 |
|---|
| ChTry LTQ |
 |
|---|
| ArgC LTQ |
 |
|---|
| LysN LTQ |
 |
|---|
| TryLysC LTQ |
 |
|---|
| Try MSlow |
 |
|---|
| ChTry MSlow |
 |
|---|
| ArgC MSlow |
 |
|---|
| LysN MSlow |
 |
|---|
| TryLysC MSlow |
 |
|---|
| Try MShigh |
 |
|---|
| ChTry MShigh |
 |
|---|
| ArgC MShigh |
 |
|---|
| LysN MShigh |
 |
|---|
| TryLysC MShigh |
 |
|---|
General Statistics
Number of major isoforms |
Number of additional isoforms |
Number of all proteins |
Number of amino acids |
Min. Seq. Length |
Max. Seq. Length |
Avg. Seq. Length |
Avg. Mol. Weight |
|---|---|---|---|---|---|---|---|
0 |
534300 |
35 |
1585 |
282.7 |
31.51 |
Amino acid frequency
Ala |
Cys |
Asp |
Glu |
Phe |
Gly |
His |
Ile |
Lys |
Leu |
|---|---|---|---|---|---|---|---|---|---|
8.106 ± 0.057 | 0.365 ± 0.012 |
5.962 ± 0.061 | 5.998 ± 0.069 |
4.179 ± 0.042 | 6.704 ± 0.054 |
2.072 ± 0.027 | 6.885 ± 0.054 |
6.414 ± 0.059 | 9.593 ± 0.062 |
Met |
Asn |
Gln |
Pro |
Arg |
Ser |
Thr |
Val |
Trp |
Tyr |
|---|---|---|---|---|---|---|---|---|---|
2.691 ± 0.026 | 4.755 ± 0.034 |
3.571 ± 0.028 | 4.51 ± 0.043 |
4.162 ± 0.044 | 6.036 ± 0.056 |
6.325 ± 0.048 | 7.27 ± 0.051 |
0.992 ± 0.023 | 3.41 ± 0.038 |
Most of the basic statistics you can see at this page can be downloaded from this CSV file
Proteome-pI is available under Creative Commons Attribution-NoDerivs license, for more details see here
| Reference: Kozlowski LP. Proteome-pI 2.0: Proteome Isoelectric Point Database Update. Nucleic Acids Res. 2021, doi: 10.1093/nar/gkab944 | Contact: Lukasz P. Kozlowski |
