Micromonospora sp. CB01531
Taxonomy: cellular organisms; Bacteria; Terrabacteria group; Actinobacteria; Actinomycetia; Micromonosporales; Micromonosporaceae; Micromonospora; unclassified Micromonospora
Average proteome isoelectric point is 6.61
Get precalculated fractions of proteins

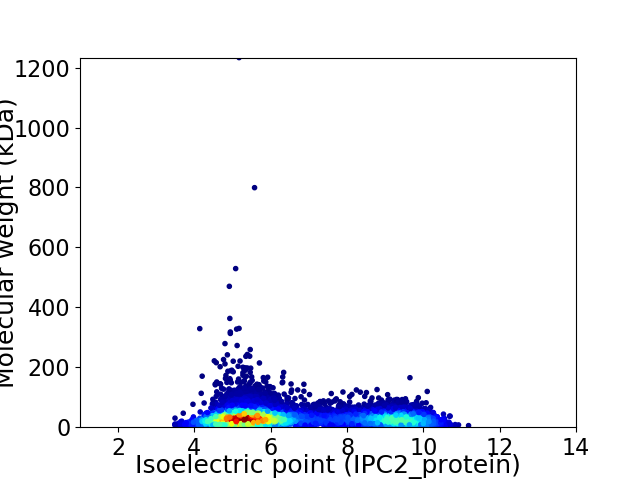
Virtual 2D-PAGE plot for 7693 proteins (isoelectric point calculated using IPC2_protein)
Get csv file with sequences according to given criteria:
* You can choose from 21 different methods for calculating isoelectric point
Summary statistics related to proteome-wise predictions


Protein with the lowest isoelectric point:
>tr|A0A1Q4ZD15|A0A1Q4ZD15_9ACTN Glyoxalase OS=Micromonospora sp. CB01531 OX=1718947 GN=A6A27_38400 PE=4 SV=1
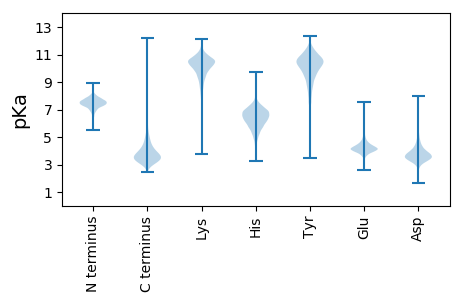
MM1 pKa = 8.31DD2 pKa = 4.22SQQSLHH8 pKa = 6.5VNSQQSVDD16 pKa = 3.6SSQTLHH22 pKa = 7.38DD23 pKa = 4.07FVLNLLTDD31 pKa = 4.23PDD33 pKa = 3.68ARR35 pKa = 11.84SAFDD39 pKa = 4.84LDD41 pKa = 4.23PEE43 pKa = 4.73GALQAAGLTDD53 pKa = 3.29VTAADD58 pKa = 3.9VQDD61 pKa = 3.98VVPLVVDD68 pKa = 3.91YY69 pKa = 10.3AAPGAGLAPLAPVAGQLGLDD89 pKa = 4.2PLASDD94 pKa = 3.45ATDD97 pKa = 3.36VVGQLAAAPQQISVNSTYY115 pKa = 11.27AGVDD119 pKa = 3.35VSAGALGAIAVDD131 pKa = 3.7PAGLYY136 pKa = 10.5AGAAVLPGIGLGIGPGGLATDD157 pKa = 4.05LTGAHH162 pKa = 6.64DD163 pKa = 3.86VAHH166 pKa = 6.39TLDD169 pKa = 3.83SDD171 pKa = 4.12VVGAVNTAVDD181 pKa = 4.03PVVGDD186 pKa = 3.82LAGTAGDD193 pKa = 4.14PLGTATGTGVLSGDD207 pKa = 3.62GVLGGDD213 pKa = 4.08LGVLSGTQAQVNGVVGSLGVDD234 pKa = 3.18HH235 pKa = 6.96TLGGLGLGDD244 pKa = 3.46GAGGVVPPVHH254 pKa = 6.69VPTTVDD260 pKa = 3.47GVTQQVNGTLSGVTGTVNGVSGTVGGLTAGVTGDD294 pKa = 3.67AGAHH298 pKa = 6.0GSATVHH304 pKa = 6.3GDD306 pKa = 2.84VHH308 pKa = 7.06ASSDD312 pKa = 3.48GGLLGGLLL320 pKa = 3.81
MM1 pKa = 8.31DD2 pKa = 4.22SQQSLHH8 pKa = 6.5VNSQQSVDD16 pKa = 3.6SSQTLHH22 pKa = 7.38DD23 pKa = 4.07FVLNLLTDD31 pKa = 4.23PDD33 pKa = 3.68ARR35 pKa = 11.84SAFDD39 pKa = 4.84LDD41 pKa = 4.23PEE43 pKa = 4.73GALQAAGLTDD53 pKa = 3.29VTAADD58 pKa = 3.9VQDD61 pKa = 3.98VVPLVVDD68 pKa = 3.91YY69 pKa = 10.3AAPGAGLAPLAPVAGQLGLDD89 pKa = 4.2PLASDD94 pKa = 3.45ATDD97 pKa = 3.36VVGQLAAAPQQISVNSTYY115 pKa = 11.27AGVDD119 pKa = 3.35VSAGALGAIAVDD131 pKa = 3.7PAGLYY136 pKa = 10.5AGAAVLPGIGLGIGPGGLATDD157 pKa = 4.05LTGAHH162 pKa = 6.64DD163 pKa = 3.86VAHH166 pKa = 6.39TLDD169 pKa = 3.83SDD171 pKa = 4.12VVGAVNTAVDD181 pKa = 4.03PVVGDD186 pKa = 3.82LAGTAGDD193 pKa = 4.14PLGTATGTGVLSGDD207 pKa = 3.62GVLGGDD213 pKa = 4.08LGVLSGTQAQVNGVVGSLGVDD234 pKa = 3.18HH235 pKa = 6.96TLGGLGLGDD244 pKa = 3.46GAGGVVPPVHH254 pKa = 6.69VPTTVDD260 pKa = 3.47GVTQQVNGTLSGVTGTVNGVSGTVGGLTAGVTGDD294 pKa = 3.67AGAHH298 pKa = 6.0GSATVHH304 pKa = 6.3GDD306 pKa = 2.84VHH308 pKa = 7.06ASSDD312 pKa = 3.48GGLLGGLLL320 pKa = 3.81
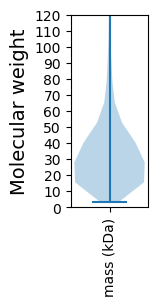
Molecular weight: 30.23 kDa
Isoelectric point according different methods:
Protein with the highest isoelectric point:
>tr|A0A1Q5AFR1|A0A1Q5AFR1_9ACTN Uncharacterized protein OS=Micromonospora sp. CB01531 OX=1718947 GN=A6A27_06445 PE=4 SV=1
MM1 pKa = 7.74SKK3 pKa = 8.93RR4 pKa = 11.84TYY6 pKa = 10.0QPNNRR11 pKa = 11.84RR12 pKa = 11.84RR13 pKa = 11.84AKK15 pKa = 8.7THH17 pKa = 5.15GFRR20 pKa = 11.84LRR22 pKa = 11.84MRR24 pKa = 11.84TRR26 pKa = 11.84AGRR29 pKa = 11.84AIISTRR35 pKa = 11.84RR36 pKa = 11.84AKK38 pKa = 10.47GRR40 pKa = 11.84ARR42 pKa = 11.84LAAA45 pKa = 4.44
MM1 pKa = 7.74SKK3 pKa = 8.93RR4 pKa = 11.84TYY6 pKa = 10.0QPNNRR11 pKa = 11.84RR12 pKa = 11.84RR13 pKa = 11.84AKK15 pKa = 8.7THH17 pKa = 5.15GFRR20 pKa = 11.84LRR22 pKa = 11.84MRR24 pKa = 11.84TRR26 pKa = 11.84AGRR29 pKa = 11.84AIISTRR35 pKa = 11.84RR36 pKa = 11.84AKK38 pKa = 10.47GRR40 pKa = 11.84ARR42 pKa = 11.84LAAA45 pKa = 4.44
Molecular weight: 5.3 kDa
Isoelectric point according different methods:
Peptides (in silico digests for buttom-up proteomics)
Below you can find in silico digests of the whole proteome with Trypsin, Chymotrypsin, Trypsin+LysC, LysN, ArgC proteases suitable for different mass spec machines.| Try ESI |
 |
|---|
| ChTry ESI |
 |
|---|
| ArgC ESI |
 |
|---|
| LysN ESI |
 |
|---|
| TryLysC ESI |
 |
|---|
| Try MALDI |
 |
|---|
| ChTry MALDI |
 |
|---|
| ArgC MALDI |
 |
|---|
| LysN MALDI |
 |
|---|
| TryLysC MALDI |
 |
|---|
| Try LTQ |
 |
|---|
| ChTry LTQ |
 |
|---|
| ArgC LTQ |
 |
|---|
| LysN LTQ |
 |
|---|
| TryLysC LTQ |
 |
|---|
| Try MSlow |
 |
|---|
| ChTry MSlow |
 |
|---|
| ArgC MSlow |
 |
|---|
| LysN MSlow |
 |
|---|
| TryLysC MSlow |
 |
|---|
| Try MShigh |
 |
|---|
| ChTry MShigh |
 |
|---|
| ArgC MShigh |
 |
|---|
| LysN MShigh |
 |
|---|
| TryLysC MShigh |
 |
|---|
General Statistics
Number of major isoforms |
Number of additional isoforms |
Number of all proteins |
Number of amino acids |
Min. Seq. Length |
Max. Seq. Length |
Avg. Seq. Length |
Avg. Mol. Weight |
|---|---|---|---|---|---|---|---|
0 |
2502689 |
29 |
11474 |
325.3 |
34.83 |
Amino acid frequency
Ala |
Cys |
Asp |
Glu |
Phe |
Gly |
His |
Ile |
Lys |
Leu |
|---|---|---|---|---|---|---|---|---|---|
13.985 ± 0.05 | 0.741 ± 0.008 |
6.049 ± 0.023 | 5.017 ± 0.027 |
2.681 ± 0.017 | 9.251 ± 0.026 |
2.157 ± 0.015 | 3.263 ± 0.02 |
1.779 ± 0.024 | 10.558 ± 0.044 |
Met |
Asn |
Gln |
Pro |
Arg |
Ser |
Thr |
Val |
Trp |
Tyr |
|---|---|---|---|---|---|---|---|---|---|
1.619 ± 0.01 | 1.884 ± 0.019 |
6.359 ± 0.025 | 2.864 ± 0.018 |
8.342 ± 0.032 | 4.674 ± 0.027 |
6.113 ± 0.032 | 8.877 ± 0.028 |
1.647 ± 0.013 | 2.139 ± 0.014 |
Most of the basic statistics you can see at this page can be downloaded from this CSV file
Proteome-pI is available under Creative Commons Attribution-NoDerivs license, for more details see here
| Reference: Kozlowski LP. Proteome-pI 2.0: Proteome Isoelectric Point Database Update. Nucleic Acids Res. 2021, doi: 10.1093/nar/gkab944 | Contact: Lukasz P. Kozlowski |
