Homoserinibacter sp. GY 40078
Taxonomy: cellular organisms; Bacteria; Terrabacteria group; Actinobacteria; Actinomycetia; Micrococcales; Microbacteriaceae; Homoserinibacter; unclassified Homoserinibacter
Average proteome isoelectric point is 5.95
Get precalculated fractions of proteins

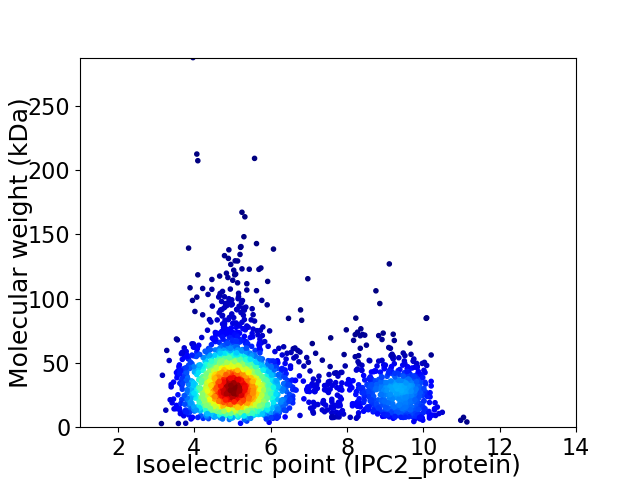
Virtual 2D-PAGE plot for 2789 proteins (isoelectric point calculated using IPC2_protein)
Get csv file with sequences according to given criteria:
* You can choose from 21 different methods for calculating isoelectric point
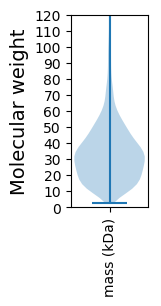
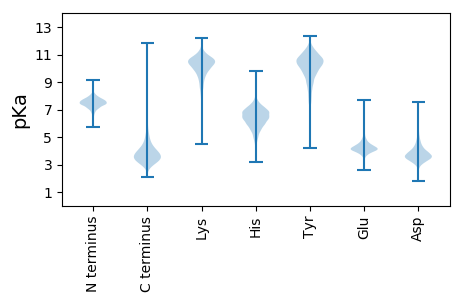
Summary statistics related to proteome-wise predictions


Protein with the lowest isoelectric point:
>tr|A0A5C8IE42|A0A5C8IE42_9MICO SAM-dependent methyltransferase OS=Homoserinibacter sp. GY 40078 OX=2603275 GN=FVQ89_12680 PE=4 SV=1
MM1 pKa = 7.35ARR3 pKa = 11.84VPEE6 pKa = 4.28PEE8 pKa = 4.09MTPEE12 pKa = 4.31GPAYY16 pKa = 9.92EE17 pKa = 4.59GRR19 pKa = 11.84LLDD22 pKa = 3.95RR23 pKa = 11.84ADD25 pKa = 4.13EE26 pKa = 4.22EE27 pKa = 5.16VVDD30 pKa = 4.38QGASFDD36 pKa = 3.46IRR38 pKa = 11.84TLLTRR43 pKa = 11.84RR44 pKa = 11.84NVLGLGILGVGAATLVACAPTSDD67 pKa = 4.05SSTSSSSSGSTSSGSTGTTDD87 pKa = 4.36ASGLPSGEE95 pKa = 4.46IPDD98 pKa = 4.11EE99 pKa = 4.17TAGPYY104 pKa = 10.2PGDD107 pKa = 3.77GSNGPDD113 pKa = 3.17VLEE116 pKa = 3.67QSGIVRR122 pKa = 11.84SDD124 pKa = 2.66IRR126 pKa = 11.84SSIDD130 pKa = 2.91GGATAEE136 pKa = 4.13GVPLEE141 pKa = 4.23FSLTITDD148 pKa = 4.05MANDD152 pKa = 4.02DD153 pKa = 4.06APFEE157 pKa = 4.35GVAVYY162 pKa = 9.79AWHH165 pKa = 7.55CDD167 pKa = 3.19AQGRR171 pKa = 11.84YY172 pKa = 8.61SMYY175 pKa = 10.6SEE177 pKa = 4.12GVEE180 pKa = 4.0DD181 pKa = 3.48EE182 pKa = 4.49TYY184 pKa = 11.07LRR186 pKa = 11.84GVQVADD192 pKa = 3.66EE193 pKa = 4.49NGVVTFTSIFPACYY207 pKa = 8.34TGRR210 pKa = 11.84WPHH213 pKa = 5.89IHH215 pKa = 6.43FEE217 pKa = 4.33VYY219 pKa = 10.15PDD221 pKa = 4.25LDD223 pKa = 4.48SISDD227 pKa = 3.73STNAIATSQIAMPEE241 pKa = 4.2DD242 pKa = 3.7VCNTVYY248 pKa = 11.07ALSAYY253 pKa = 10.14DD254 pKa = 3.76GSSSNLSQVSLDD266 pKa = 3.33TDD268 pKa = 3.58NVFGEE273 pKa = 4.85DD274 pKa = 3.69GGALQLATVSGDD286 pKa = 2.98VDD288 pKa = 3.53SGYY291 pKa = 8.65TASLVARR298 pKa = 11.84VDD300 pKa = 3.55TTTTPSSGDD309 pKa = 3.41APSGGGQGGGQGDD322 pKa = 4.65TPPGDD327 pKa = 3.56APSRR331 pKa = 3.78
MM1 pKa = 7.35ARR3 pKa = 11.84VPEE6 pKa = 4.28PEE8 pKa = 4.09MTPEE12 pKa = 4.31GPAYY16 pKa = 9.92EE17 pKa = 4.59GRR19 pKa = 11.84LLDD22 pKa = 3.95RR23 pKa = 11.84ADD25 pKa = 4.13EE26 pKa = 4.22EE27 pKa = 5.16VVDD30 pKa = 4.38QGASFDD36 pKa = 3.46IRR38 pKa = 11.84TLLTRR43 pKa = 11.84RR44 pKa = 11.84NVLGLGILGVGAATLVACAPTSDD67 pKa = 4.05SSTSSSSSGSTSSGSTGTTDD87 pKa = 4.36ASGLPSGEE95 pKa = 4.46IPDD98 pKa = 4.11EE99 pKa = 4.17TAGPYY104 pKa = 10.2PGDD107 pKa = 3.77GSNGPDD113 pKa = 3.17VLEE116 pKa = 3.67QSGIVRR122 pKa = 11.84SDD124 pKa = 2.66IRR126 pKa = 11.84SSIDD130 pKa = 2.91GGATAEE136 pKa = 4.13GVPLEE141 pKa = 4.23FSLTITDD148 pKa = 4.05MANDD152 pKa = 4.02DD153 pKa = 4.06APFEE157 pKa = 4.35GVAVYY162 pKa = 9.79AWHH165 pKa = 7.55CDD167 pKa = 3.19AQGRR171 pKa = 11.84YY172 pKa = 8.61SMYY175 pKa = 10.6SEE177 pKa = 4.12GVEE180 pKa = 4.0DD181 pKa = 3.48EE182 pKa = 4.49TYY184 pKa = 11.07LRR186 pKa = 11.84GVQVADD192 pKa = 3.66EE193 pKa = 4.49NGVVTFTSIFPACYY207 pKa = 8.34TGRR210 pKa = 11.84WPHH213 pKa = 5.89IHH215 pKa = 6.43FEE217 pKa = 4.33VYY219 pKa = 10.15PDD221 pKa = 4.25LDD223 pKa = 4.48SISDD227 pKa = 3.73STNAIATSQIAMPEE241 pKa = 4.2DD242 pKa = 3.7VCNTVYY248 pKa = 11.07ALSAYY253 pKa = 10.14DD254 pKa = 3.76GSSSNLSQVSLDD266 pKa = 3.33TDD268 pKa = 3.58NVFGEE273 pKa = 4.85DD274 pKa = 3.69GGALQLATVSGDD286 pKa = 2.98VDD288 pKa = 3.53SGYY291 pKa = 8.65TASLVARR298 pKa = 11.84VDD300 pKa = 3.55TTTTPSSGDD309 pKa = 3.41APSGGGQGGGQGDD322 pKa = 4.65TPPGDD327 pKa = 3.56APSRR331 pKa = 3.78
Molecular weight: 33.93 kDa
Isoelectric point according different methods:
Protein with the highest isoelectric point:
>tr|A0A5C8IEX6|A0A5C8IEX6_9MICO NAD(P)/FAD-dependent oxidoreductase OS=Homoserinibacter sp. GY 40078 OX=2603275 GN=FVQ89_01910 PE=4 SV=1
MM1 pKa = 7.4GSVIKK6 pKa = 10.42KK7 pKa = 8.47RR8 pKa = 11.84RR9 pKa = 11.84KK10 pKa = 9.22RR11 pKa = 11.84MAKK14 pKa = 9.41KK15 pKa = 9.87KK16 pKa = 9.7HH17 pKa = 5.84RR18 pKa = 11.84KK19 pKa = 8.56LLRR22 pKa = 11.84KK23 pKa = 7.78TRR25 pKa = 11.84HH26 pKa = 3.65QRR28 pKa = 11.84RR29 pKa = 11.84NKK31 pKa = 9.78KK32 pKa = 9.85
MM1 pKa = 7.4GSVIKK6 pKa = 10.42KK7 pKa = 8.47RR8 pKa = 11.84RR9 pKa = 11.84KK10 pKa = 9.22RR11 pKa = 11.84MAKK14 pKa = 9.41KK15 pKa = 9.87KK16 pKa = 9.7HH17 pKa = 5.84RR18 pKa = 11.84KK19 pKa = 8.56LLRR22 pKa = 11.84KK23 pKa = 7.78TRR25 pKa = 11.84HH26 pKa = 3.65QRR28 pKa = 11.84RR29 pKa = 11.84NKK31 pKa = 9.78KK32 pKa = 9.85
Molecular weight: 4.08 kDa
Isoelectric point according different methods:
Peptides (in silico digests for buttom-up proteomics)
Below you can find in silico digests of the whole proteome with Trypsin, Chymotrypsin, Trypsin+LysC, LysN, ArgC proteases suitable for different mass spec machines.| Try ESI |
 |
|---|
| ChTry ESI |
 |
|---|
| ArgC ESI |
 |
|---|
| LysN ESI |
 |
|---|
| TryLysC ESI |
 |
|---|
| Try MALDI |
 |
|---|
| ChTry MALDI |
 |
|---|
| ArgC MALDI |
 |
|---|
| LysN MALDI |
 |
|---|
| TryLysC MALDI |
 |
|---|
| Try LTQ |
 |
|---|
| ChTry LTQ |
 |
|---|
| ArgC LTQ |
 |
|---|
| LysN LTQ |
 |
|---|
| TryLysC LTQ |
 |
|---|
| Try MSlow |
 |
|---|
| ChTry MSlow |
 |
|---|
| ArgC MSlow |
 |
|---|
| LysN MSlow |
 |
|---|
| TryLysC MSlow |
 |
|---|
| Try MShigh |
 |
|---|
| ChTry MShigh |
 |
|---|
| ArgC MShigh |
 |
|---|
| LysN MShigh |
 |
|---|
| TryLysC MShigh |
 |
|---|
General Statistics
Number of major isoforms |
Number of additional isoforms |
Number of all proteins |
Number of amino acids |
Min. Seq. Length |
Max. Seq. Length |
Avg. Seq. Length |
Avg. Mol. Weight |
|---|---|---|---|---|---|---|---|
0 |
918376 |
25 |
2785 |
329.3 |
35.23 |
Amino acid frequency
Ala |
Cys |
Asp |
Glu |
Phe |
Gly |
His |
Ile |
Lys |
Leu |
|---|---|---|---|---|---|---|---|---|---|
13.429 ± 0.068 | 0.454 ± 0.009 |
6.318 ± 0.041 | 5.879 ± 0.044 |
3.099 ± 0.027 | 9.029 ± 0.041 |
1.896 ± 0.019 | 4.588 ± 0.031 |
1.693 ± 0.034 | 10.247 ± 0.048 |
Met |
Asn |
Gln |
Pro |
Arg |
Ser |
Thr |
Val |
Trp |
Tyr |
|---|---|---|---|---|---|---|---|---|---|
1.676 ± 0.018 | 1.81 ± 0.024 |
5.47 ± 0.032 | 2.561 ± 0.024 |
7.558 ± 0.058 | 5.717 ± 0.043 |
5.885 ± 0.049 | 9.14 ± 0.046 |
1.554 ± 0.019 | 1.997 ± 0.022 |
Most of the basic statistics you can see at this page can be downloaded from this CSV file
Proteome-pI is available under Creative Commons Attribution-NoDerivs license, for more details see here
| Reference: Kozlowski LP. Proteome-pI 2.0: Proteome Isoelectric Point Database Update. Nucleic Acids Res. 2021, doi: 10.1093/nar/gkab944 | Contact: Lukasz P. Kozlowski |
