Trypanosoma congolense (strain IL3000)
Taxonomy: cellular organisms; Eukaryota; Discoba; Euglenozoa; Kinetoplastea; Metakinetoplastina; Trypanosomatida; Trypanosomatidae; Trypanosoma; Nannomonas; Trypanosoma congolense
Average proteome isoelectric point is 7.04
Get precalculated fractions of proteins

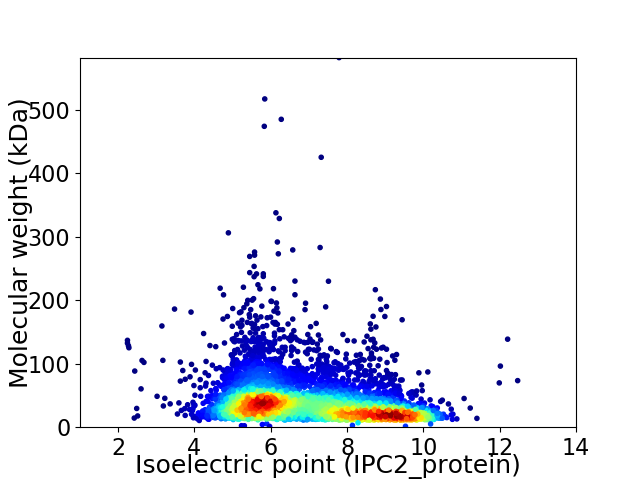
Virtual 2D-PAGE plot for 5906 proteins (isoelectric point calculated using IPC2_protein)
Get csv file with sequences according to given criteria:
* You can choose from 21 different methods for calculating isoelectric point
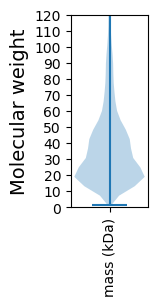
Summary statistics related to proteome-wise predictions


Protein with the lowest isoelectric point:
>tr|F9WIH8|F9WIH8_TRYCI WGS project CAEQ00000000 data annotated contig 794 OS=Trypanosoma congolense (strain IL3000) OX=1068625 GN=TCIL3000_0_19740 PE=4 SV=1
MM1 pKa = 7.67SLRR4 pKa = 11.84AQWNMKK10 pKa = 9.63EE11 pKa = 4.25GSFAGNAGGIDD22 pKa = 3.71SPNDD26 pKa = 3.27CSSASGIMDD35 pKa = 4.66GLHH38 pKa = 7.33LIPEE42 pKa = 4.23QGVVDD47 pKa = 4.26ALQPVAHH54 pKa = 7.34AGQAEE59 pKa = 4.01NSADD63 pKa = 3.48GALSFDD69 pKa = 5.2FIFHH73 pKa = 6.73SMQPNDD79 pKa = 3.18VNRR82 pKa = 11.84DD83 pKa = 3.22VNANCVASEE92 pKa = 4.11GDD94 pKa = 3.71PSRR97 pKa = 11.84STAFGGFCFDD107 pKa = 4.07YY108 pKa = 10.84ACSDD112 pKa = 3.89GAWPEE117 pKa = 4.07GNAVATDD124 pKa = 3.96AAAMGVGINNPTTQEE139 pKa = 4.07APFHH143 pKa = 6.59LLLTDD148 pKa = 4.6DD149 pKa = 4.57PVVPCDD155 pKa = 3.72EE156 pKa = 4.64PLHH159 pKa = 6.24PGFPKK164 pKa = 10.67ASS166 pKa = 3.39
MM1 pKa = 7.67SLRR4 pKa = 11.84AQWNMKK10 pKa = 9.63EE11 pKa = 4.25GSFAGNAGGIDD22 pKa = 3.71SPNDD26 pKa = 3.27CSSASGIMDD35 pKa = 4.66GLHH38 pKa = 7.33LIPEE42 pKa = 4.23QGVVDD47 pKa = 4.26ALQPVAHH54 pKa = 7.34AGQAEE59 pKa = 4.01NSADD63 pKa = 3.48GALSFDD69 pKa = 5.2FIFHH73 pKa = 6.73SMQPNDD79 pKa = 3.18VNRR82 pKa = 11.84DD83 pKa = 3.22VNANCVASEE92 pKa = 4.11GDD94 pKa = 3.71PSRR97 pKa = 11.84STAFGGFCFDD107 pKa = 4.07YY108 pKa = 10.84ACSDD112 pKa = 3.89GAWPEE117 pKa = 4.07GNAVATDD124 pKa = 3.96AAAMGVGINNPTTQEE139 pKa = 4.07APFHH143 pKa = 6.59LLLTDD148 pKa = 4.6DD149 pKa = 4.57PVVPCDD155 pKa = 3.72EE156 pKa = 4.64PLHH159 pKa = 6.24PGFPKK164 pKa = 10.67ASS166 pKa = 3.39
Molecular weight: 17.21 kDa
Isoelectric point according different methods:
Protein with the highest isoelectric point:
>tr|F9WCD2|F9WCD2_TRYCI WGS project CAEQ00000000 data annotated contig 2213 OS=Trypanosoma congolense (strain IL3000) OX=1068625 GN=TCIL3000_0_54940 PE=4 SV=1
MM1 pKa = 7.91APPFIPPHH9 pKa = 6.21PSNGLGLGLGLGLGLGLGLGLGLGLGLGLGLGLGLGLGLGLGLGLGLGLGLGLGLGLGLGLGLGLGLGLGLGLGLGLGLGLGLGLGLGLGLGLGLGLGLGLGLGLGLGLGLGLGLGLGLGLGLGLGLGLGLGLGLGLGLGLGLGLGLGLGLGLGLGLGLGLGLGLGLGLGLGLGLGLGLGLGLGLGLGLGLGLGLGLGLGLGLGLGLGLGLGLGLGLGLGLGLGLGLGLGLGLGLGLGLGLGLGLGLGLGLGLGLGLGLGLGLGLGLGLGLGLGLGLGLGLGLGLGLGLGLRR301 pKa = 11.84LGLGLGLRR309 pKa = 11.84LPLRR313 pKa = 11.84LGFGLGLRR321 pKa = 11.84VRR323 pKa = 11.84VRR325 pKa = 11.84LRR327 pKa = 11.84VRR329 pKa = 11.84LRR331 pKa = 11.84LTVRR335 pKa = 11.84VRR337 pKa = 11.84LL338 pKa = 3.85
MM1 pKa = 7.91APPFIPPHH9 pKa = 6.21PSNGLGLGLGLGLGLGLGLGLGLGLGLGLGLGLGLGLGLGLGLGLGLGLGLGLGLGLGLGLGLGLGLGLGLGLGLGLGLGLGLGLGLGLGLGLGLGLGLGLGLGLGLGLGLGLGLGLGLGLGLGLGLGLGLGLGLGLGLGLGLGLGLGLGLGLGLGLGLGLGLGLGLGLGLGLGLGLGLGLGLGLGLGLGLGLGLGLGLGLGLGLGLGLGLGLGLGLGLGLGLGLGLGLGLGLGLGLGLGLGLGLGLGLGLGLGLGLGLGLGLGLGLGLGLGLGLGLGLGLGLGLGLGLGLRR301 pKa = 11.84LGLGLGLRR309 pKa = 11.84LPLRR313 pKa = 11.84LGFGLGLRR321 pKa = 11.84VRR323 pKa = 11.84VRR325 pKa = 11.84LRR327 pKa = 11.84VRR329 pKa = 11.84LRR331 pKa = 11.84LTVRR335 pKa = 11.84VRR337 pKa = 11.84LL338 pKa = 3.85
Molecular weight: 30.19 kDa
Isoelectric point according different methods:
Peptides (in silico digests for buttom-up proteomics)
Below you can find in silico digests of the whole proteome with Trypsin, Chymotrypsin, Trypsin+LysC, LysN, ArgC proteases suitable for different mass spec machines.| Try ESI |
 |
|---|
| ChTry ESI |
 |
|---|
| ArgC ESI |
 |
|---|
| LysN ESI |
 |
|---|
| TryLysC ESI |
 |
|---|
| Try MALDI |
 |
|---|
| ChTry MALDI |
 |
|---|
| ArgC MALDI |
 |
|---|
| LysN MALDI |
 |
|---|
| TryLysC MALDI |
 |
|---|
| Try LTQ |
 |
|---|
| ChTry LTQ |
 |
|---|
| ArgC LTQ |
 |
|---|
| LysN LTQ |
 |
|---|
| TryLysC LTQ |
 |
|---|
| Try MSlow |
 |
|---|
| ChTry MSlow |
 |
|---|
| ArgC MSlow |
 |
|---|
| LysN MSlow |
 |
|---|
| TryLysC MSlow |
 |
|---|
| Try MShigh |
 |
|---|
| ChTry MShigh |
 |
|---|
| ArgC MShigh |
 |
|---|
| LysN MShigh |
 |
|---|
| TryLysC MShigh |
 |
|---|
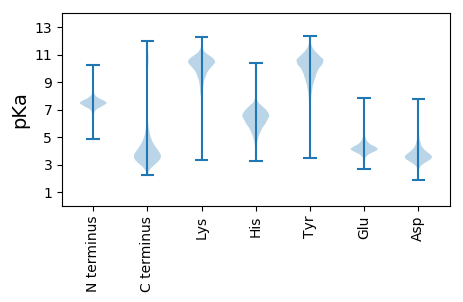
General Statistics
Number of major isoforms |
Number of additional isoforms |
Number of all proteins |
Number of amino acids |
Min. Seq. Length |
Max. Seq. Length |
Avg. Seq. Length |
Avg. Mol. Weight |
|---|---|---|---|---|---|---|---|
0 |
2211927 |
11 |
4553 |
374.5 |
41.66 |
Amino acid frequency
Ala |
Cys |
Asp |
Glu |
Phe |
Gly |
His |
Ile |
Lys |
Leu |
|---|---|---|---|---|---|---|---|---|---|
7.967 ± 0.048 | 2.539 ± 0.029 |
4.794 ± 0.029 | 6.729 ± 0.058 |
3.651 ± 0.031 | 6.802 ± 0.037 |
2.779 ± 0.037 | 4.237 ± 0.045 |
5.054 ± 0.038 | 9.196 ± 0.043 |
Met |
Asn |
Gln |
Pro |
Arg |
Ser |
Thr |
Val |
Trp |
Tyr |
|---|---|---|---|---|---|---|---|---|---|
2.48 ± 0.038 | 3.711 ± 0.031 |
4.966 ± 0.038 | 3.705 ± 0.049 |
6.582 ± 0.039 | 7.904 ± 0.048 |
5.612 ± 0.037 | 7.284 ± 0.045 |
1.405 ± 0.015 | 2.593 ± 0.049 |
Most of the basic statistics you can see at this page can be downloaded from this CSV file
Proteome-pI is available under Creative Commons Attribution-NoDerivs license, for more details see here
| Reference: Kozlowski LP. Proteome-pI 2.0: Proteome Isoelectric Point Database Update. Nucleic Acids Res. 2021, doi: 10.1093/nar/gkab944 | Contact: Lukasz P. Kozlowski |
