Halobellus sp. Atlit-38R
Taxonomy: cellular organisms; Archaea; Euryarchaeota; Stenosarchaea group; Halobacteria; Haloferacales; Haloferacaceae; Halobellus; unclassified Halobellus
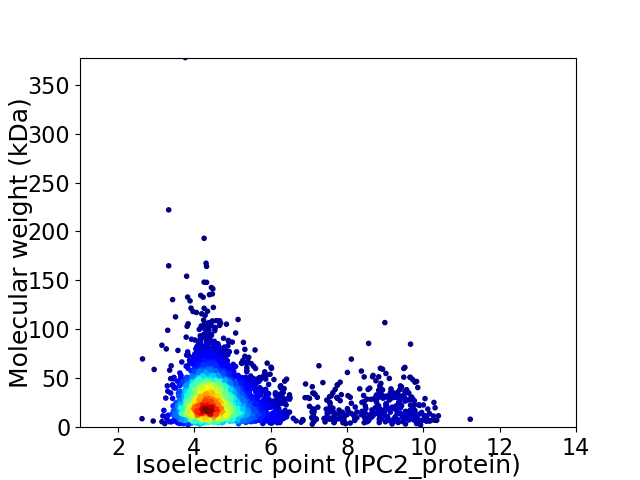
Average proteome isoelectric point is 4.94
Get precalculated fractions of proteins

Virtual 2D-PAGE plot for 3864 proteins (isoelectric point calculated using IPC2_protein)
Get csv file with sequences according to given criteria:
* You can choose from 21 different methods for calculating isoelectric point
Summary statistics related to proteome-wise predictions


Protein with the lowest isoelectric point:
>tr|A0A498G955|A0A498G955_9EURY Phosphonate ABC transporter permease protein PhnE OS=Halobellus sp. Atlit-38R OX=2282131 GN=phnE PE=3 SV=1
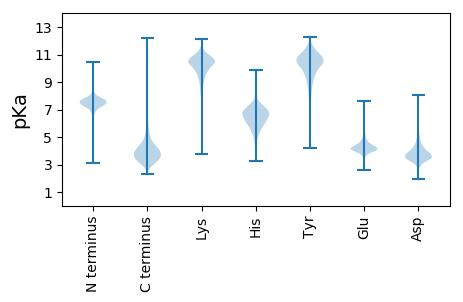
MM1 pKa = 7.7SDD3 pKa = 2.91SHH5 pKa = 8.44DD6 pKa = 3.66NDD8 pKa = 3.27GLTRR12 pKa = 11.84RR13 pKa = 11.84RR14 pKa = 11.84ALGAGGAVLTLALAGCSGTGDD35 pKa = 3.25GGTTEE40 pKa = 4.55TEE42 pKa = 4.47TATSTQTDD50 pKa = 3.82TATPTAEE57 pKa = 4.09PTTTEE62 pKa = 3.81TGEE65 pKa = 4.09ASLSALEE72 pKa = 4.24VPEE75 pKa = 4.69DD76 pKa = 4.04ANCAVCNMKK85 pKa = 9.58PAKK88 pKa = 10.34FPDD91 pKa = 3.7YY92 pKa = 10.54NAQLQYY98 pKa = 10.93EE99 pKa = 4.25SSEE102 pKa = 4.05PKK104 pKa = 10.12FFCSNGCMASFAADD118 pKa = 3.5PGHH121 pKa = 6.63FEE123 pKa = 3.98EE124 pKa = 6.39AYY126 pKa = 10.54ADD128 pKa = 3.74ASIAAAFVHH137 pKa = 7.0DD138 pKa = 5.24HH139 pKa = 7.11DD140 pKa = 4.18TTDD143 pKa = 3.77WIDD146 pKa = 3.62GLAASYY152 pKa = 10.35VLEE155 pKa = 4.3MDD157 pKa = 4.11SEE159 pKa = 4.45RR160 pKa = 11.84VDD162 pKa = 3.34DD163 pKa = 4.3PMRR166 pKa = 11.84INPLAFDD173 pKa = 4.16TEE175 pKa = 4.39ADD177 pKa = 3.01ATAYY181 pKa = 10.25VEE183 pKa = 4.71QYY185 pKa = 11.69DD186 pKa = 4.28DD187 pKa = 3.76LTAEE191 pKa = 4.38DD192 pKa = 4.3VVGFDD197 pKa = 4.89AFDD200 pKa = 4.51RR201 pKa = 11.84DD202 pKa = 3.24LAEE205 pKa = 3.95QYY207 pKa = 9.95RR208 pKa = 11.84ASFFEE213 pKa = 4.12
MM1 pKa = 7.7SDD3 pKa = 2.91SHH5 pKa = 8.44DD6 pKa = 3.66NDD8 pKa = 3.27GLTRR12 pKa = 11.84RR13 pKa = 11.84RR14 pKa = 11.84ALGAGGAVLTLALAGCSGTGDD35 pKa = 3.25GGTTEE40 pKa = 4.55TEE42 pKa = 4.47TATSTQTDD50 pKa = 3.82TATPTAEE57 pKa = 4.09PTTTEE62 pKa = 3.81TGEE65 pKa = 4.09ASLSALEE72 pKa = 4.24VPEE75 pKa = 4.69DD76 pKa = 4.04ANCAVCNMKK85 pKa = 9.58PAKK88 pKa = 10.34FPDD91 pKa = 3.7YY92 pKa = 10.54NAQLQYY98 pKa = 10.93EE99 pKa = 4.25SSEE102 pKa = 4.05PKK104 pKa = 10.12FFCSNGCMASFAADD118 pKa = 3.5PGHH121 pKa = 6.63FEE123 pKa = 3.98EE124 pKa = 6.39AYY126 pKa = 10.54ADD128 pKa = 3.74ASIAAAFVHH137 pKa = 7.0DD138 pKa = 5.24HH139 pKa = 7.11DD140 pKa = 4.18TTDD143 pKa = 3.77WIDD146 pKa = 3.62GLAASYY152 pKa = 10.35VLEE155 pKa = 4.3MDD157 pKa = 4.11SEE159 pKa = 4.45RR160 pKa = 11.84VDD162 pKa = 3.34DD163 pKa = 4.3PMRR166 pKa = 11.84INPLAFDD173 pKa = 4.16TEE175 pKa = 4.39ADD177 pKa = 3.01ATAYY181 pKa = 10.25VEE183 pKa = 4.71QYY185 pKa = 11.69DD186 pKa = 4.28DD187 pKa = 3.76LTAEE191 pKa = 4.38DD192 pKa = 4.3VVGFDD197 pKa = 4.89AFDD200 pKa = 4.51RR201 pKa = 11.84DD202 pKa = 3.24LAEE205 pKa = 3.95QYY207 pKa = 9.95RR208 pKa = 11.84ASFFEE213 pKa = 4.12
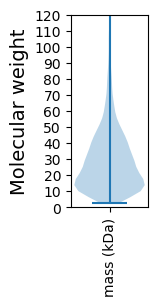
Molecular weight: 22.74 kDa
Isoelectric point according different methods:
Protein with the highest isoelectric point:
>tr|A0A498GFM9|A0A498GFM9_9EURY TIGR03663 family protein OS=Halobellus sp. Atlit-38R OX=2282131 GN=D3D02_02410 PE=4 SV=1
MM1 pKa = 7.52GPRR4 pKa = 11.84RR5 pKa = 11.84RR6 pKa = 11.84AGRR9 pKa = 11.84GVPPRR14 pKa = 11.84ARR16 pKa = 11.84PRR18 pKa = 11.84RR19 pKa = 11.84ARR21 pKa = 11.84GRR23 pKa = 11.84RR24 pKa = 11.84PRR26 pKa = 11.84RR27 pKa = 11.84RR28 pKa = 11.84RR29 pKa = 11.84TRR31 pKa = 11.84GPTTTRR37 pKa = 11.84SGPARR42 pKa = 11.84TAPRR46 pKa = 11.84RR47 pKa = 11.84RR48 pKa = 11.84TRR50 pKa = 11.84RR51 pKa = 11.84RR52 pKa = 11.84HH53 pKa = 4.52RR54 pKa = 11.84RR55 pKa = 11.84CRR57 pKa = 11.84RR58 pKa = 11.84RR59 pKa = 11.84RR60 pKa = 11.84RR61 pKa = 11.84PSEE64 pKa = 3.74RR65 pKa = 11.84RR66 pKa = 3.31
MM1 pKa = 7.52GPRR4 pKa = 11.84RR5 pKa = 11.84RR6 pKa = 11.84AGRR9 pKa = 11.84GVPPRR14 pKa = 11.84ARR16 pKa = 11.84PRR18 pKa = 11.84RR19 pKa = 11.84ARR21 pKa = 11.84GRR23 pKa = 11.84RR24 pKa = 11.84PRR26 pKa = 11.84RR27 pKa = 11.84RR28 pKa = 11.84RR29 pKa = 11.84TRR31 pKa = 11.84GPTTTRR37 pKa = 11.84SGPARR42 pKa = 11.84TAPRR46 pKa = 11.84RR47 pKa = 11.84RR48 pKa = 11.84TRR50 pKa = 11.84RR51 pKa = 11.84RR52 pKa = 11.84HH53 pKa = 4.52RR54 pKa = 11.84RR55 pKa = 11.84CRR57 pKa = 11.84RR58 pKa = 11.84RR59 pKa = 11.84RR60 pKa = 11.84RR61 pKa = 11.84PSEE64 pKa = 3.74RR65 pKa = 11.84RR66 pKa = 3.31
Molecular weight: 8.12 kDa
Isoelectric point according different methods:
Peptides (in silico digests for buttom-up proteomics)
Below you can find in silico digests of the whole proteome with Trypsin, Chymotrypsin, Trypsin+LysC, LysN, ArgC proteases suitable for different mass spec machines.| Try ESI |
 |
|---|
| ChTry ESI |
 |
|---|
| ArgC ESI |
 |
|---|
| LysN ESI |
 |
|---|
| TryLysC ESI |
 |
|---|
| Try MALDI |
 |
|---|
| ChTry MALDI |
 |
|---|
| ArgC MALDI |
 |
|---|
| LysN MALDI |
 |
|---|
| TryLysC MALDI |
 |
|---|
| Try LTQ |
 |
|---|
| ChTry LTQ |
 |
|---|
| ArgC LTQ |
 |
|---|
| LysN LTQ |
 |
|---|
| TryLysC LTQ |
 |
|---|
| Try MSlow |
 |
|---|
| ChTry MSlow |
 |
|---|
| ArgC MSlow |
 |
|---|
| LysN MSlow |
 |
|---|
| TryLysC MSlow |
 |
|---|
| Try MShigh |
 |
|---|
| ChTry MShigh |
 |
|---|
| ArgC MShigh |
 |
|---|
| LysN MShigh |
 |
|---|
| TryLysC MShigh |
 |
|---|
General Statistics
Number of major isoforms |
Number of additional isoforms |
Number of all proteins |
Number of amino acids |
Min. Seq. Length |
Max. Seq. Length |
Avg. Seq. Length |
Avg. Mol. Weight |
|---|---|---|---|---|---|---|---|
0 |
1075213 |
21 |
3681 |
278.3 |
30.21 |
Amino acid frequency
Ala |
Cys |
Asp |
Glu |
Phe |
Gly |
His |
Ile |
Lys |
Leu |
|---|---|---|---|---|---|---|---|---|---|
10.95 ± 0.054 | 0.657 ± 0.013 |
8.273 ± 0.049 | 8.384 ± 0.058 |
3.317 ± 0.03 | 8.42 ± 0.041 |
1.943 ± 0.022 | 4.179 ± 0.034 |
1.913 ± 0.024 | 8.88 ± 0.058 |
Met |
Asn |
Gln |
Pro |
Arg |
Ser |
Thr |
Val |
Trp |
Tyr |
|---|---|---|---|---|---|---|---|---|---|
1.667 ± 0.02 | 2.425 ± 0.027 |
4.559 ± 0.025 | 2.755 ± 0.036 |
6.451 ± 0.05 | 5.809 ± 0.036 |
6.551 ± 0.058 | 9.07 ± 0.046 |
1.102 ± 0.017 | 2.697 ± 0.02 |
Most of the basic statistics you can see at this page can be downloaded from this CSV file
Proteome-pI is available under Creative Commons Attribution-NoDerivs license, for more details see here
| Reference: Kozlowski LP. Proteome-pI 2.0: Proteome Isoelectric Point Database Update. Nucleic Acids Res. 2021, doi: 10.1093/nar/gkab944 | Contact: Lukasz P. Kozlowski |
